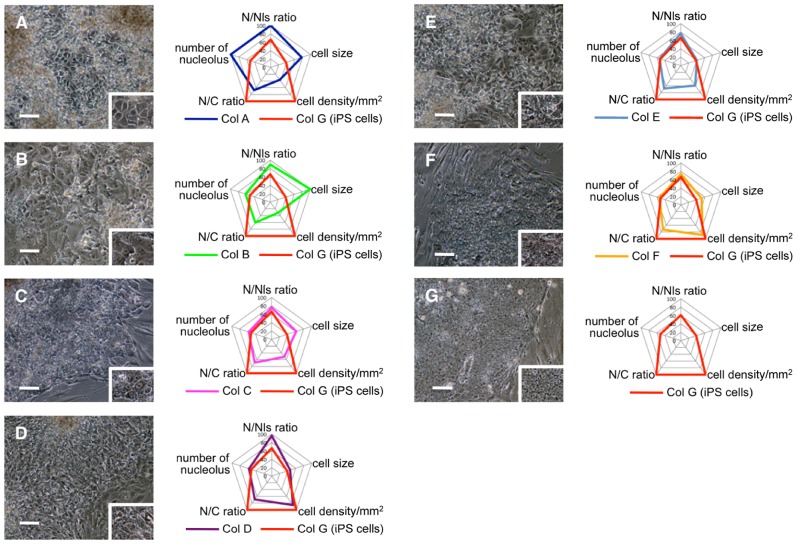
Figure 2. Morphometric analysis of colonies generated from human fibroblasts using four retroviral vectors encoding Oct3/4, Sox2, Klf4, and c-Myc.
(A–G) Photographs and parameters of colonies A∼G. Graphs shows parameters of each classified colony, including that of iPS cell colony G. The numerical value in the graph indicate the ratio to the maximum value (setting 100 for maximum value) in each parameters. N/Nls = nucleus-to-nucleolus ratio; N/C = nucleus-to-cytoplasm ratio. Scale bars = 100 µm.

