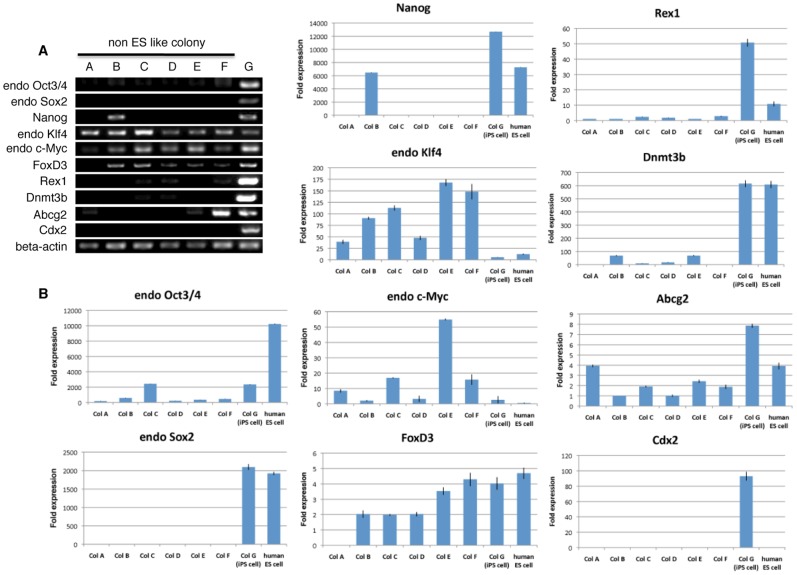
Figure 3. RT-PCR and Q-PCR of typical examples in each of colonies A∼F, iPS cell colony G and human ES cells.
(A) RT-PCR analysis examined the expression of endogenous Oct3/4, Sox2, Nanog, Klf4, c-Myc, as well as FoxD3, Rex1, Dnmt3b, Abcg2 and Cdx2. Beta-actin was used as an internal control. (B) Q-PCR data for expression of endogenous Oct3/4, Sox2, Nanog, Klf4, c-Myc, as well as FoxD3, Rex1, Dnmt3b, Abcg2 and Cdx2. Beta-actin was used as an internal control.

