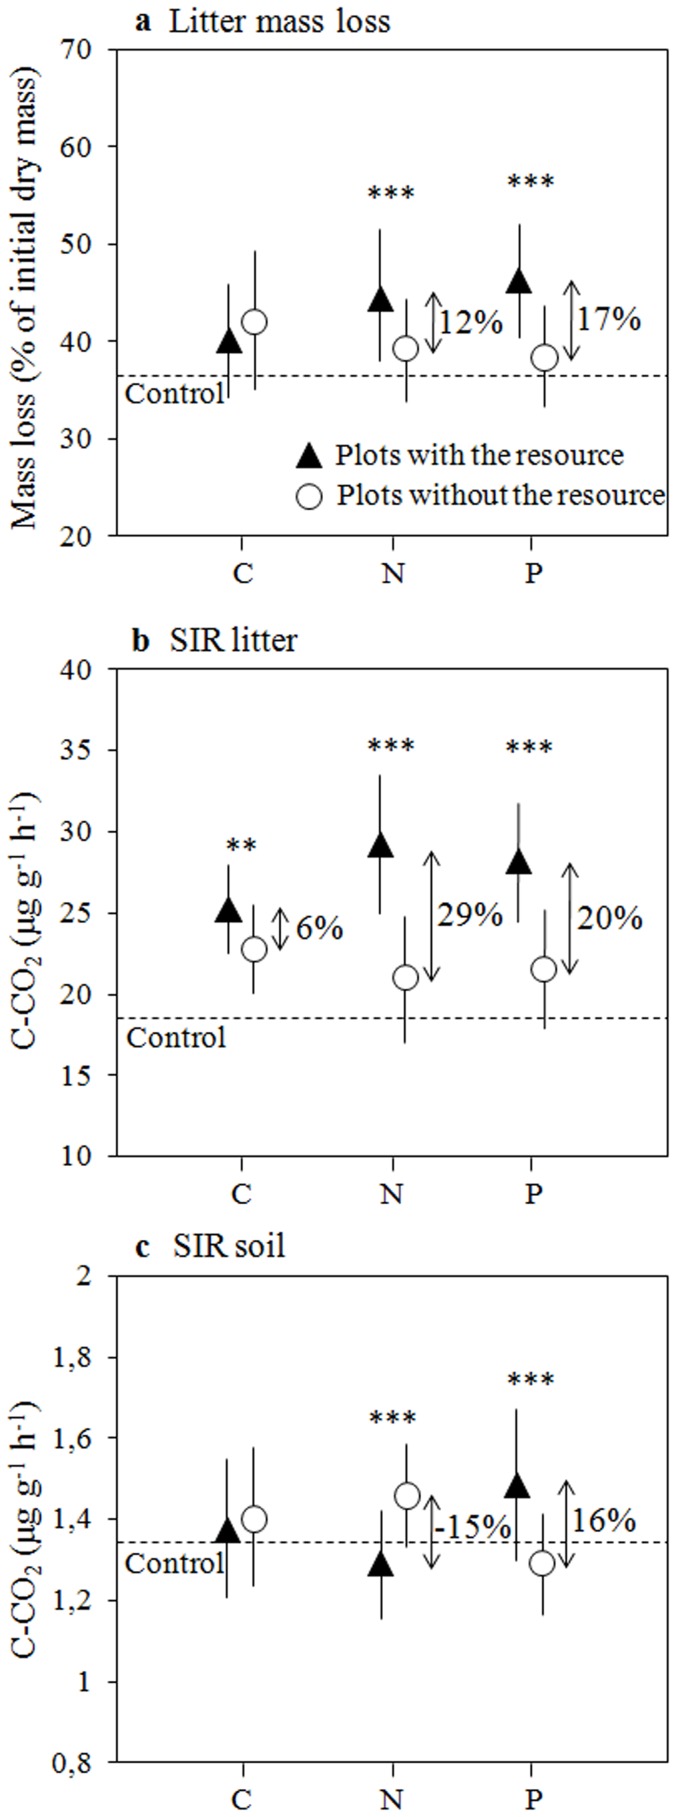
Figure 1. Effects of C, N, and P fertilization (alone or in any combination with the other resources) on (a) litter mass loss, (b) litter SIR and (c) soil SIR, without distinction of litter species and mesh size.
These effects were analyzed using linear mixed models (dashed lines indicate the mean values of control plots). Black triangles represent the mean values (± SE) for all plots receiving C, N or P fertilization, and open circles the values for all plots receiving no addition of C, N or P, respectively (e.g. C, CN, CP and CNP vs control, N, P and NP for the C resource). Stars denote significant differences between plots with or without the addition of C, N or P as follows: * (p<0.05), ** (p<0.01), *** (p<0.001).

