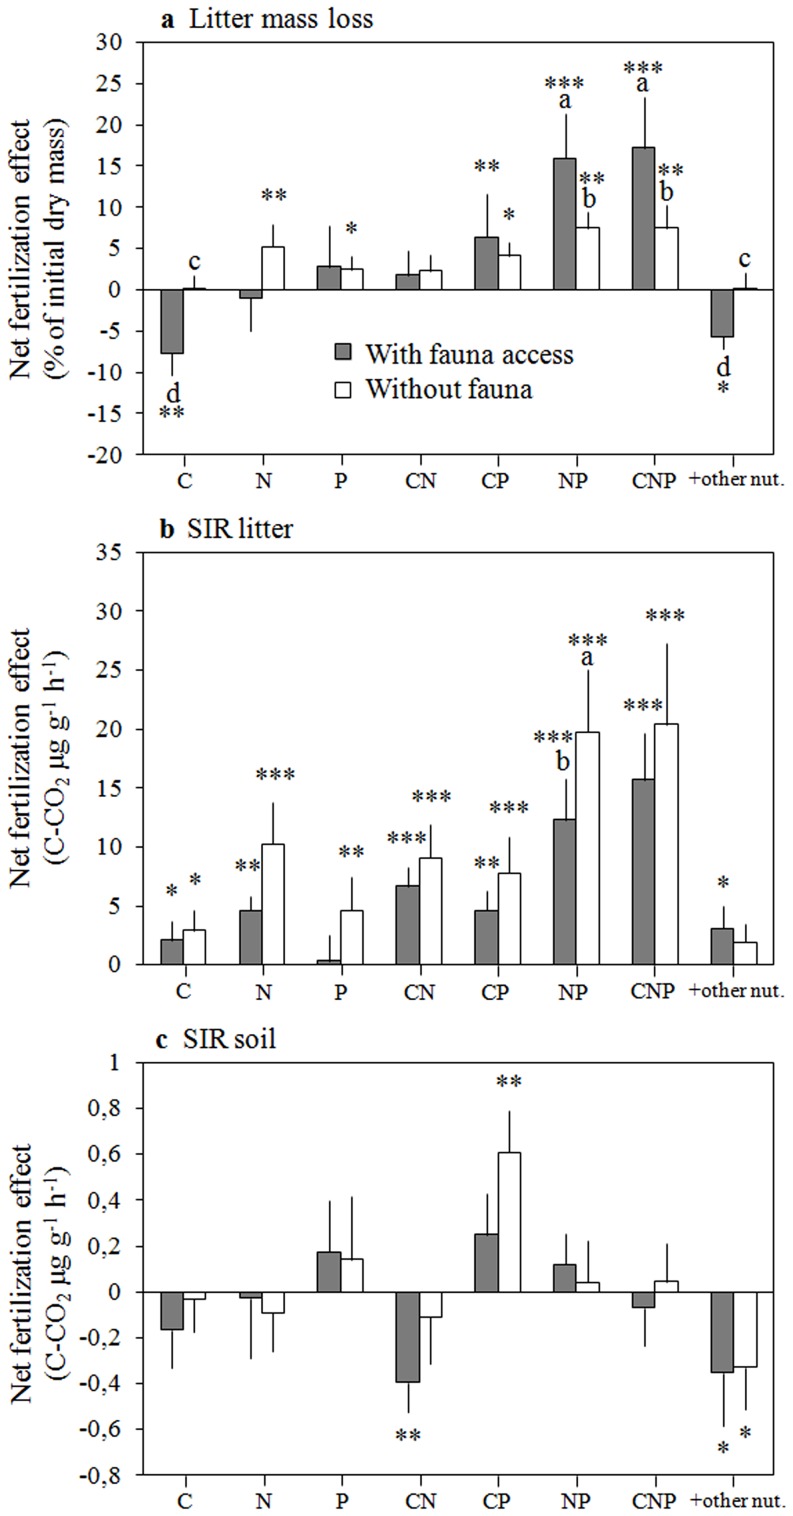
Figure 2. Net fertilization effects (mean ± SE) on (a) litter mass loss, (b) litter SIR and (c) soil SIR.
Net fertilization effects are defined as the absolute difference between values measured on control plots and those measured on the plots of the respective fertilization treatment. Gray bars represent treatments with fauna access (coarse mesh litterbags) and open bars represent treatments without fauna access (fine mesh litterbags). Different letters indicate significant differences between coarse and fine mesh litterbags for a given treatment. Stars denote net treatment effects that are significantly different from zero using paired Student's t tests: * (p<0.05), ** (p<0.001), *** (p<0.0001).

