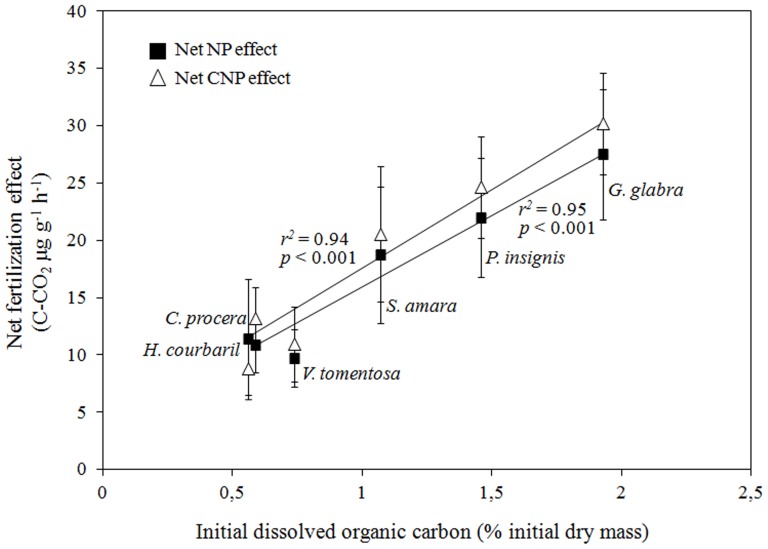
Figure 3. Net effects of NP (black squares) and CNP (open triangles) fertilization (mean ± SE) on litter SIR (data pooled across mesh-size) as a function of the initial litter species-specific DOC concentration.
Net fertilization effects are defined as the absolute difference between values measured on control plots and those measured on the plots of the respective fertilization treatment.

