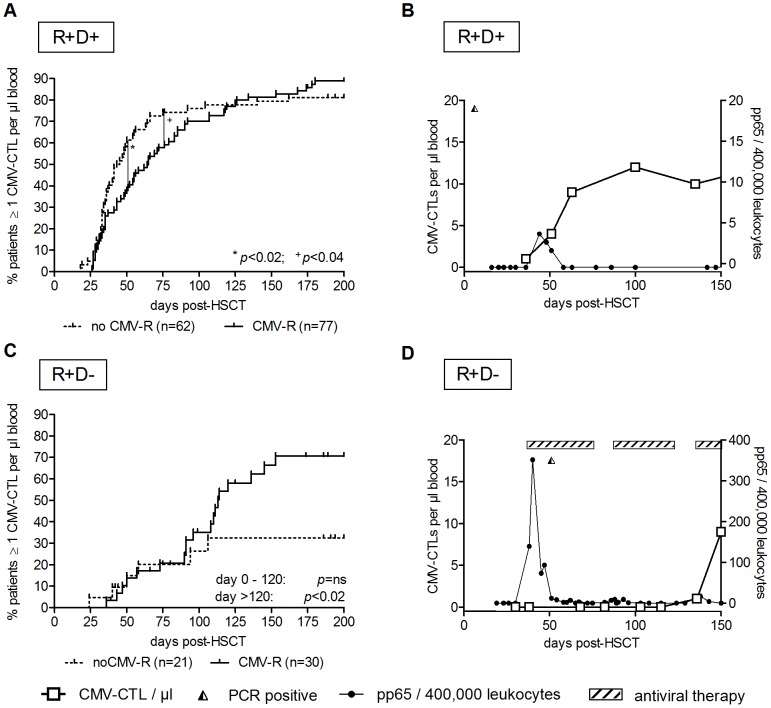
Figure 4. CMV-CTL monitoring enables early discrimination between R+/D+ patients in whom CMV reactivation did or did not occur.
(A) A threshold of 1 CMV-CTL per µl blood was applied to discriminate between patients with and without CMV reactivation in the R+/D+ group. P-values from log-rank testing are indicated for days +50 (*) and +75 (+). (B) CMV-CTL reconstitution after HSCT is shown for one patient in the R+/D+ group. CMV-CTL numbers per µl blood (left y-axis, empty squares) were plotted against the time in days after HSCT. The right y-axis (filled circles) shows the number of pp65-positive cells/400,000 leukocytes as the means of detecting CMV reactivation. Positive PCR results for CMV are indicated at the top of each graph (half filled triangle). CMV reactivation occurred on day +39 (spike in filled circle line) in this patient, after which CMV-CTL expansion occurred (rise in empty square line). (C) Reconstitution of CMV-CTLs within the R+D− group using a threshold of 1 CMV-CTL per µl blood. Until day +100 no significant reconstitution occurred. (D) Prolonged CMV immune reconstitution (empty squares) and necessary prolonged antiviral therapy (striped bar) in one patient from the R+/D− group.

