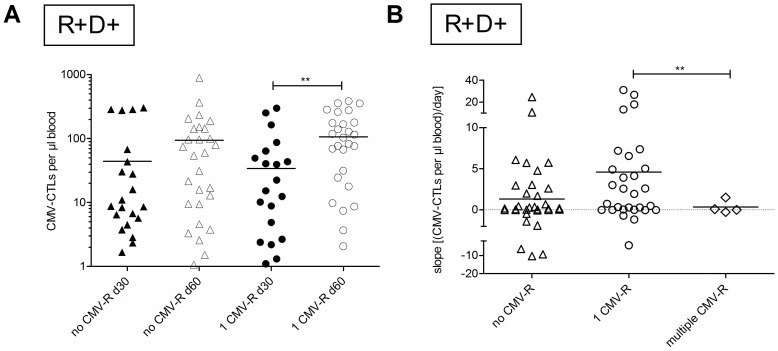
Figure 5. Kinetics of CMV-CTL expansion after CMV reactivation.
(A) CMV-CTL levels around day +30 (the interval from day +15 to +45 was assessed, filled symbols) and day +60 (the interval from day +46 to +99 was assessed, filled symbols) in patients who experienced (circles) or did not experience (triangles) a CMV reactivation prior to day +100 in the R+/D+ group. Significant differences between groups were assessed by t-test with Welch's correction, and included the 34 data points not depicted because they lie outside axis limits. (B) Patients in the R+/D+ group who experienced no (triangles), a single (circles) or multiple (diamonds) CMV reactivations before day +100 were compared (t-test with Welch's correction) using the difference between the slopes of the lines created by the CMV-CTL levels during the interval from day +15 to +45 and the interval from day +46 to +99. The dotted line indicates no change in CMV-CTL level between the measurements in both intervals. ** p≤0.01.

