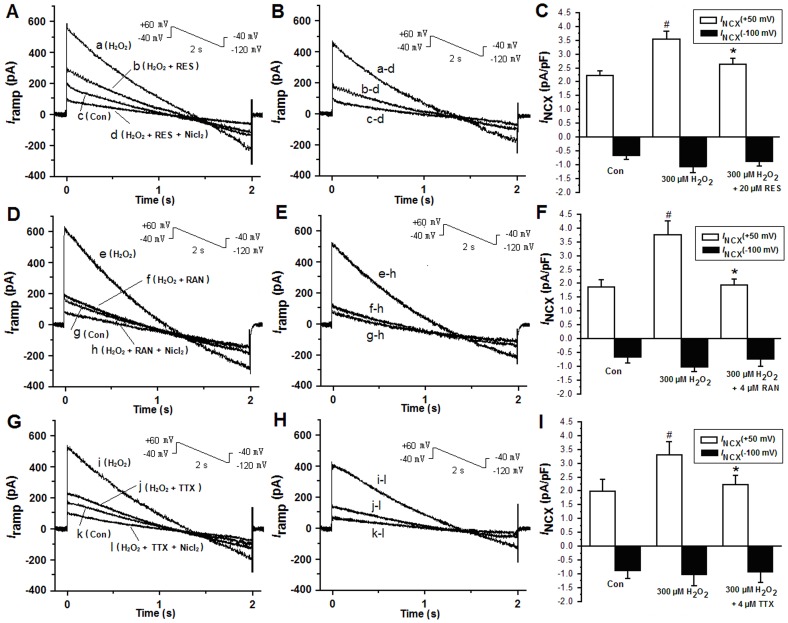
Figure 4. A. The I-T (current-time relationship) curves were constructed from the negative slope region of a ramp voltage clamp, and were sequentially shown during no drug (control, trace c), H2O2 alone (trace a), H2O2 plus 20 µM resveratrol (trace b), and Ni2+ (5 mM) (trace d) in the continued presence of 300 µM H2O2.
B. Ni2+-sensitive I NCX was obtained by subtracting the data in the trace d from the data in trace a, b, and c in panel A. The enhanced reverse I NCX induced by H2O2 was restored by 20 µM resveratrol. C. Histograms show the mean current densities of I NCX obtained from B. Values are expressed as mean ± SD, n = 8 cells/group. #P<0.01 versus control group; *P<0.01 versus H2O2 group. D. Similar to A, the I-T (current-time relationship) curves were constructed, and were shown during no drug (control, trace g), H2O2 alone (trace e), H2O2 plus 4 µM RAN (trace f), and Ni2+ (5 mM) (trace h) in the continued presence of H2O2. E. Ni2+-sensitive I NCX were obtained by subtracting the data in trace h from the data in traces e, f and g in panel D. The reverse I NCX increased by H2O2 was restored by 4 µM RAN. F. Histograms show the mean current densities of I NCX obtained from E. Values are expressed as mean ± SD, n = 8 cells/group. #P<0.01 versus control group; *P<0.01 versus H2O2 group. G. Similar to A and D, the I-T (current-time relationship) curves were constructed, and were shown during no drug (control, trace k), H2O2 alone (trace i), H2O2 plus 4 µM TTX (trace j), and Ni2+ (5 mM) (trace l) in the continued presence of H2O2. H. Ni2+-sensitive I NCX were obtained by subtracting the data in trace l from the data in traces i, j and k in panel G. The reverse I NCX increased by H2O2 was restored by 4 µM TTX. I. Histograms show the mean current densities of I NCX obtained from H. Values are expressed as mean ± SD, n = 8 cells/group. #P<0.01 versus control group; *P<0.01 versus H2O2 group.

