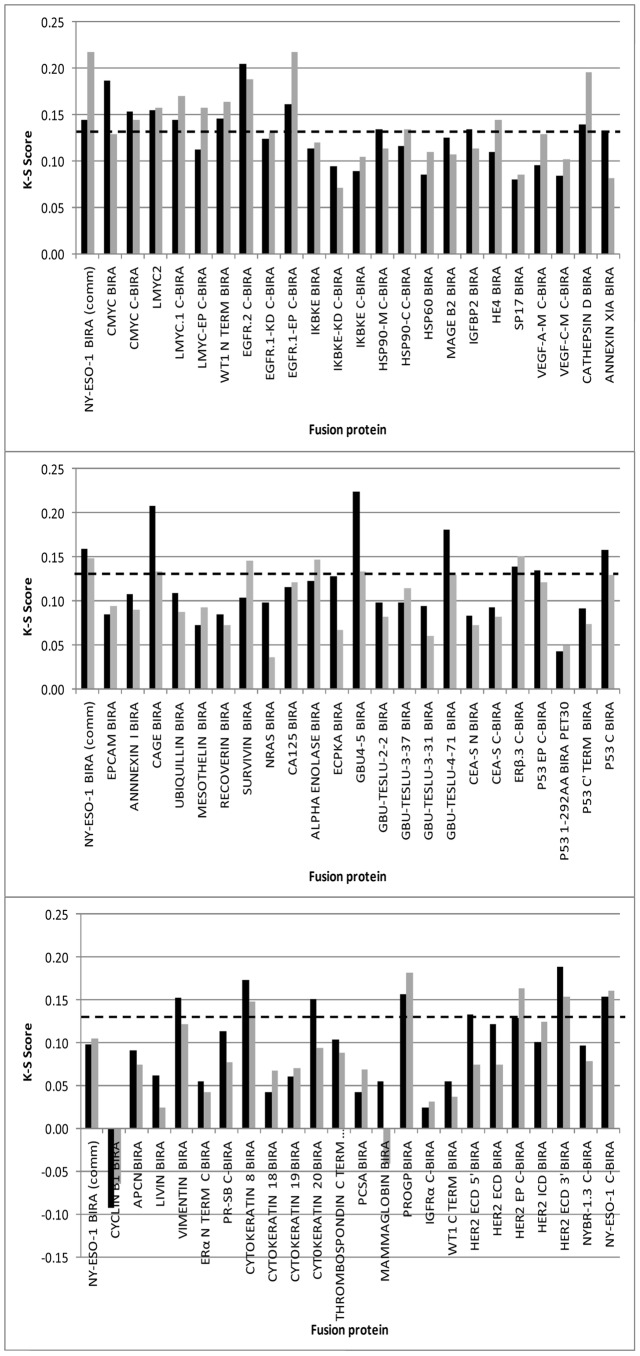
Figure 1. K-S Score for HTPA analysis of 69 fusion proteins.
Calculations were based on populations of 165 lung cancers and 165 individuals with no evidence of malignant disease (cohort 1). Bars represent fusion protein plated at 100 nM (black) and 50 nM (grey). NY-ESO-1 BirA (comm) = the cancer antigen control.

