
Figure 3.
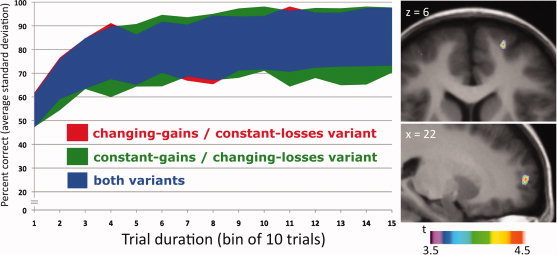
Results. The graph on the left depicts the learning curves for both variants of the task, that is, average standard deviation of percent correct choices (vertical axis) per bin of 10 trials (horizontal axis). The pictures on the right show statistical parametric maps of the change in [11C]FLB 456 BP overlaid upon a transverse (top) and a sagittal (bottom) section of the average MRI of all subjects in standardized stereotaxic space. The performance of the changing‐gains/constant‐losses variant was associated with decreased [11C]FLB 457 BP (i.e., increased dopamine release) in the right lFPC (x = 22, y = 60, z = 6; t = 4.62; P < 0.05 corr.) compared to the constant‐gains/changing‐losses variant.