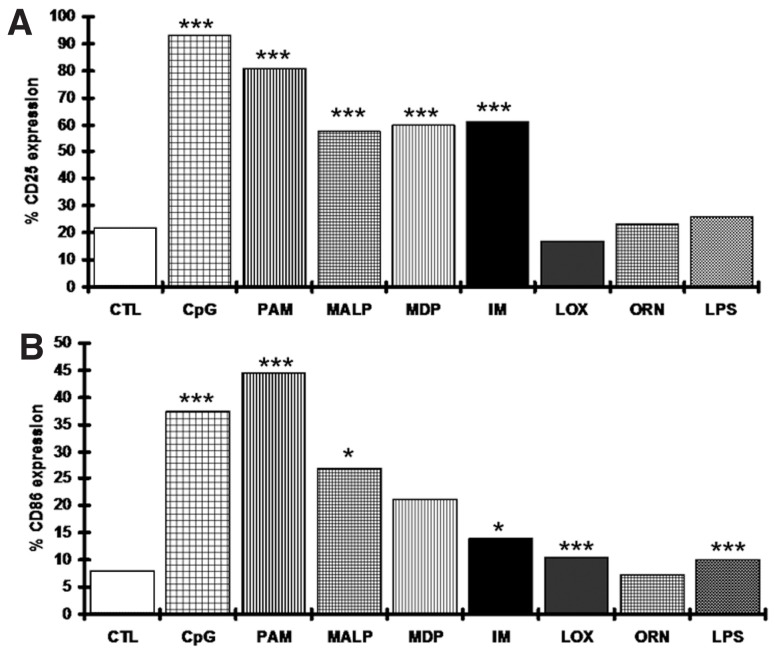
Figure 1.
CLL cells respond differently to stimulation with ligands specific for different TLRs. Changes in CD25 (A) and CD86 (B) expression in all analyzed cases. The graphs represent median values from all cases unstimulated or stimulated with a certain ligand. Statistical analysis for the comparison to the untreated control was performed using a Student t test. Differences >10% from the untreated control with p < 0.05 were considered significant (*** and * indicate p values of <0.0005 and <0.05, respectively). CTL, unstimulated control; CpG, ODN 2006; PAM, Pam3CSK4; MALP, MALP-2; IM, imiquimod; LOX, loxoribine; ORN, ORN06.

