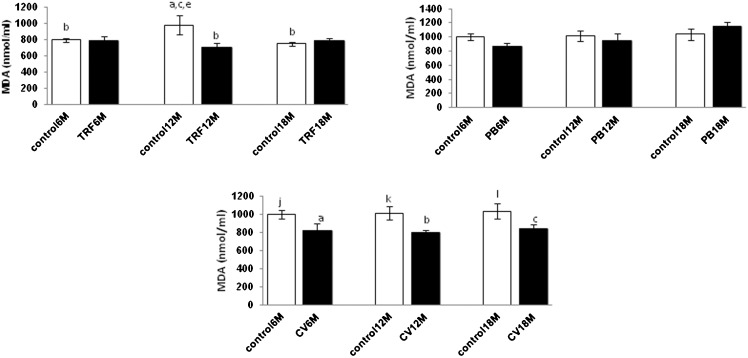
Figure 4.
Effect of PB, TRF, and CV on the plasma malondialdehyde (MDA) level in mice with different ages. Values are the mean ± S.E.M. for 8 mice. a-c: significantly different (p<0.05) from the control at 6 M, 12 M, and 18 M, respectively. d-f: significantly different (p<0.05) from TRF at 6 M, 12 M, and 18 M, respectively. g-i: significantly different (p<0.05) from PB at 6 M, 12 M, and 18 M, respectively. j-l: significantly different (P<0.05) from CV at 6 M, 12 M, and 18 M, respectively.

