
Figure 3.
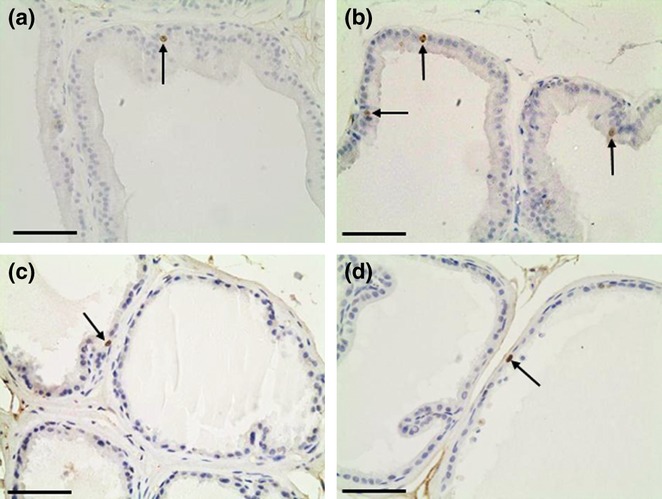
Representative sections of control (a, c) and caffeine-treated (b, d) prostatic lobes submitted to immunohistochemistry for Ki-67. Ventral (a, b) and dorsal (c, d) prostates. Note an increased number of Ki-67 positive nuclei (arrows) in caffeine-treated ventral prostates when compared with control. Scale bars: 30 μm.