
Figure 5.
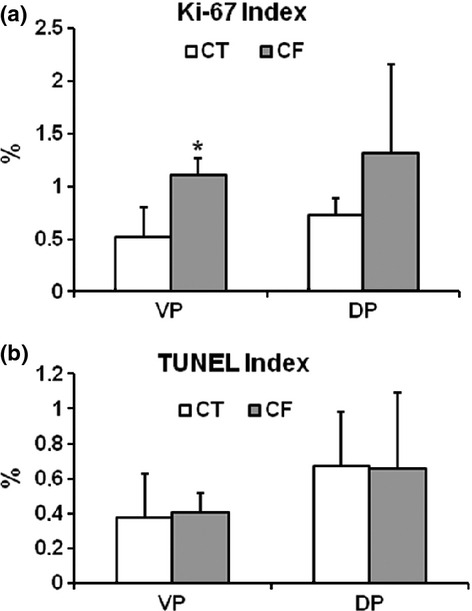
Bars graph of the proliferation and apoptotic indexes of the epithelial cells from control (CT) and caffeine-treated (CF) prostatic lobes. Ventral (VP) and dorsal (DP) prostatic lobes. (a) The proliferation index was significantly higher in the VP from the CF group. (b) No significant differences in the prostatic lobe epithelial cell apoptotic index were observed between the groups. Results are expressed as mean ± SD. *P < 0.05 when compared with the CT group.