
Figure 6.
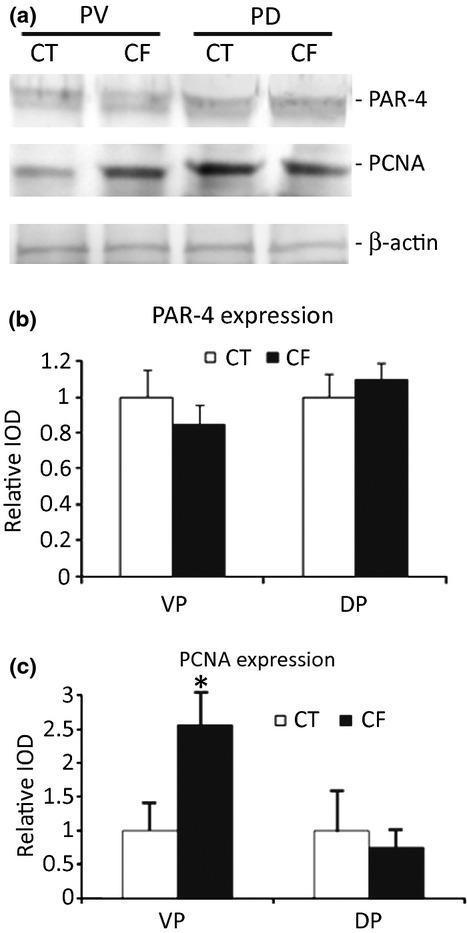
(a) Representative Western blotting for PAR-4, proliferation cell nuclear antigen (PCNA) and beta-actin expression in the rat ventral (VP) and dorsal (DP) prostatic lobes from the control (CT) and caffeine-treated animals (CF). (b) Densitometric analysis of the PAR-4 bands showing no differences between the groups in both prostatic lobes. (c) Densitometric analysis of the PCNA bands showing a significant higher expression only in the VP from the CF group. Results are expressed as mean ± SD. *Significantly different with P < 0.05.