
Figure 7.
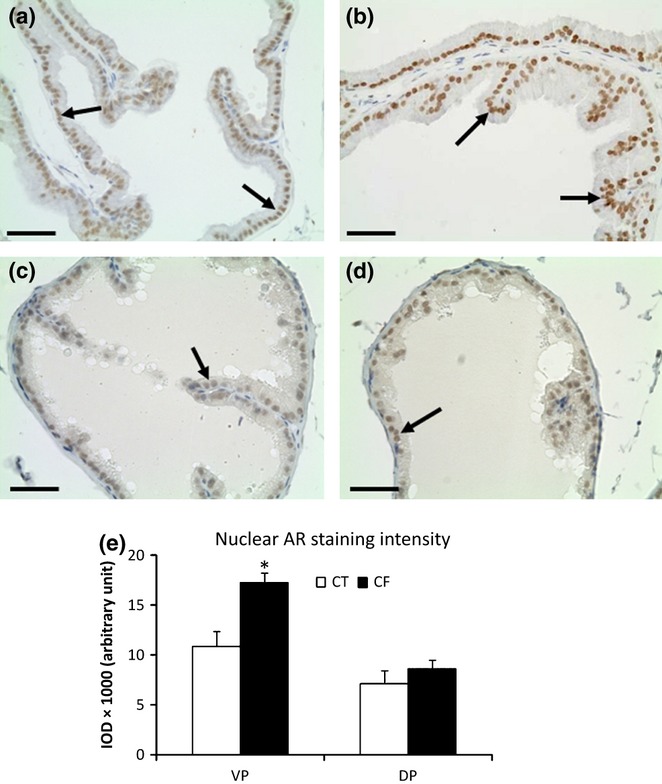
Immunohistochemistry for the androgen receptor (AR) in control (a, c) and caffeine-treated (b, d) prostates. Ventral (VP) (a, b) and dorsal (DP) (c, d) prostatic lobes. Note a uniform and higher intensity of the positive reaction in the nuclei (arrows) of the VPs from caffeine-treated group (CF) compared with the VPs from the control group. Scale bars: 30 μm. (e) Semi-quantitative analysis (IOD, integrated optical density) of the nuclear AR immunoreactivity of the epithelial cells from VP and DP in control (CT) and CF showing significant higher AR staining in the VP nuclei from CF group than CT group. Mean ± SD. Statistically significant differences: *P < 0.05.