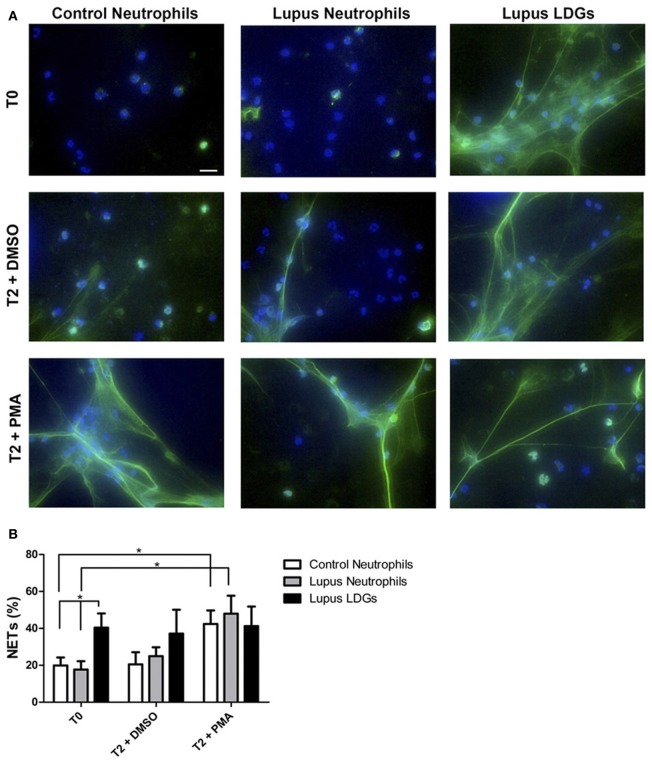
Figure 1.
Circulating lupus LDGs undergo increased NETosis. (A) Representative images of control neutrophils, lupus neutrophils, and lupus LDGs isolated from peripheral blood and analyzed at baseline (T0) or after stimulation for 2 h with DMSO or PMA. Panels show merged images of neutrophil extracellular traps (NETs) in which neutrophil elastase is stained green by immunofluorescence and DNA is stained blue by Hoechst 33342; 40× images, scale bar: 20 μm. (B) Quantification of the percentage of NETs (elastase-labeled cells over total number of cells) are plotted as mean ± SEM (n = 6 patients/group; *p = 0.05). [Obtained with permission from Villanueva et al. (2011) and The Journal of Immunology. Copyright 2011. The American Association of Immunologists, Inc.].

