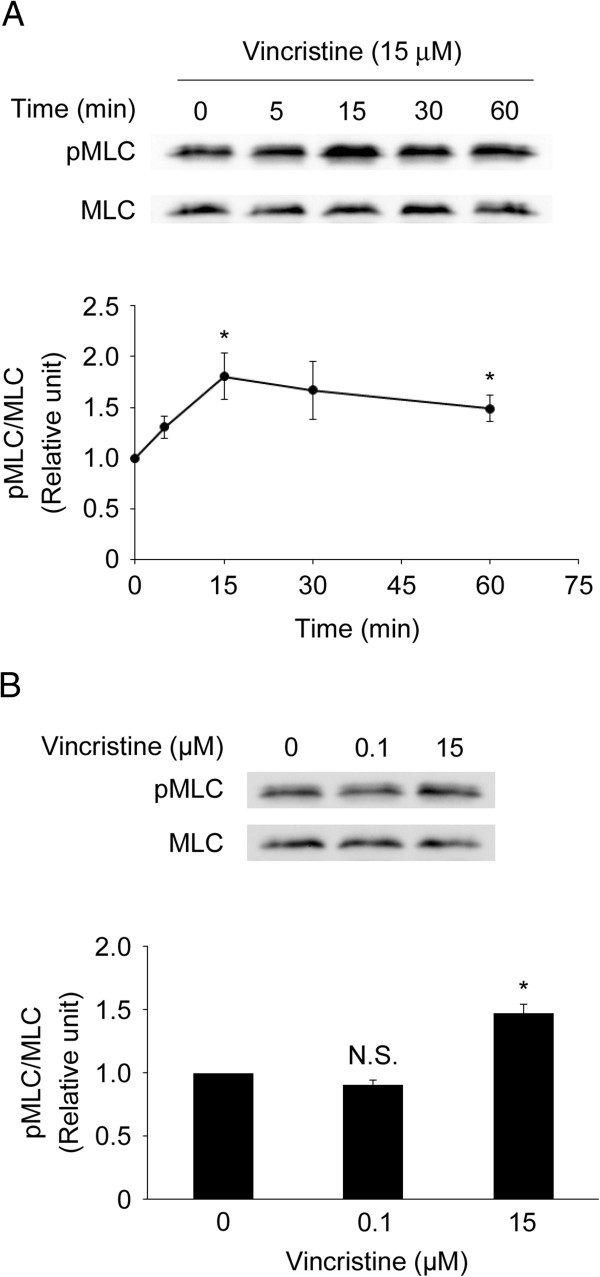
Figure 4.
MLC phosphorylation promoted by vincristine. A and B. Cells were starved in serum-free RPMI1640 for 24 h, and then treated with or without vincristine. After vincristine treatment, the cells were harvested to evaluate MLC phosphorylation by Western blotting. A, time-course; B, concentration-response at 15 min. The blots in (A) and (B) are representative of three independent experiments. The blots were quantified by densitometry, and the results were expressed as a ratio relative to the values obtained in non-treated control cells (0 min or 0 μM). The graphs in (A) and (B) show means ± S.E. of three independent experiments. *, P < 0.05 versus control.

