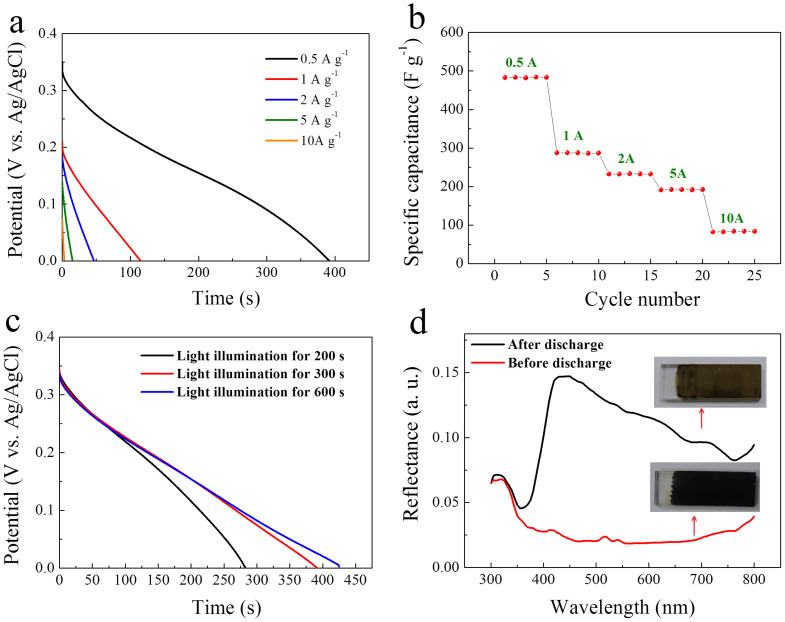
Figure 4. Pseudocapacitive properties.
(a) Discharge curves of TiO2/Ni(OH)2 core/shell nanorod arrays under simulated solar light illumination at 0.4 V bias for 300 s. The current densities from top to bottom correspond to 50, 100, 200, 500, and 1 mA cm−2, respectively. (b) Specific capacitances at various discharge current densities. (c) Discharge curves with different light illumination time at 0.4 V bias. (d) Diffuse reflectance spectra before and after discharge (Inset: photographs of samples).

