Figure 1. Phospho-RTK profiling in paired VS-nerve tissue specimens.
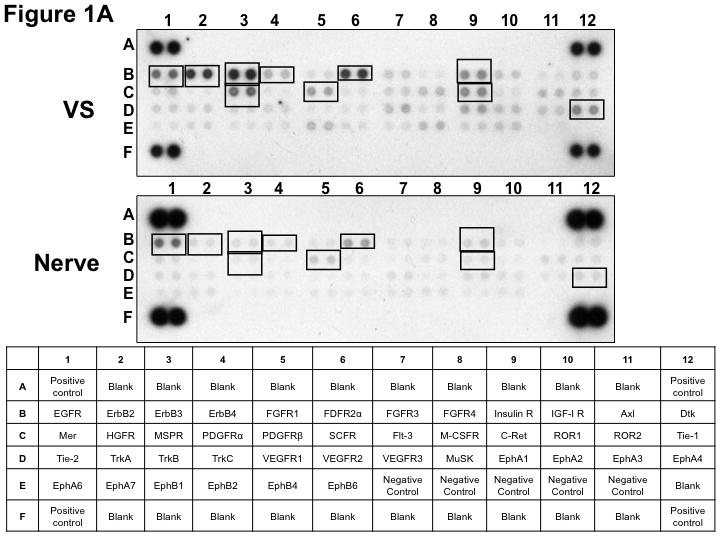
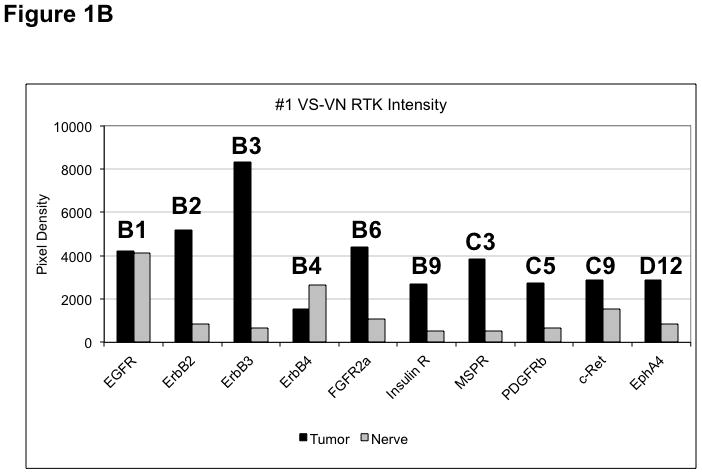
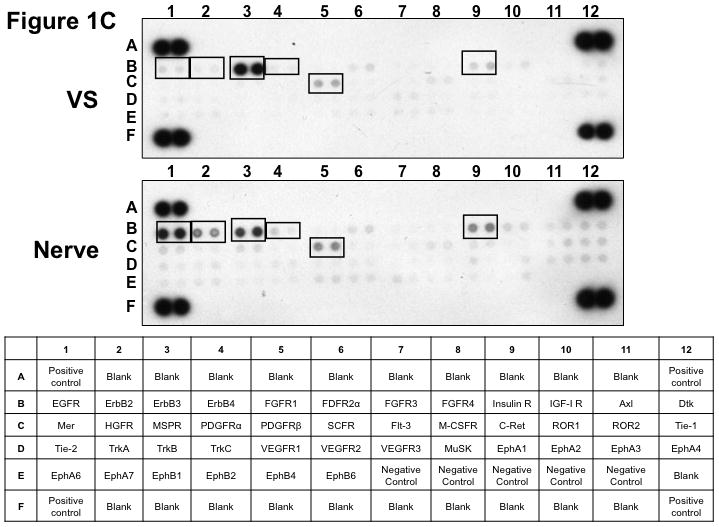
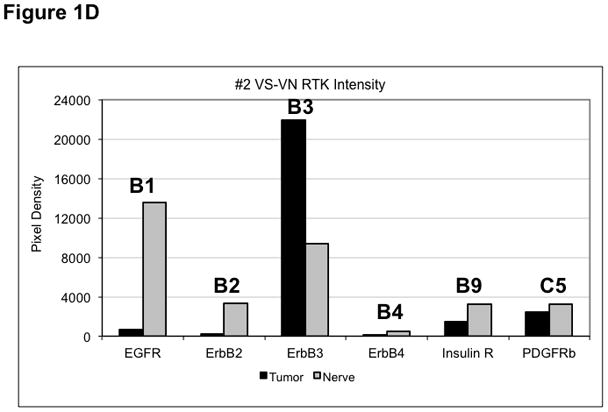
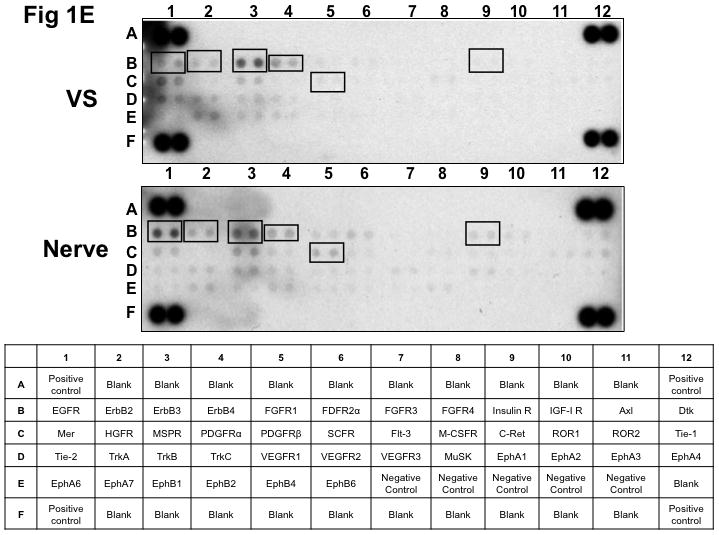
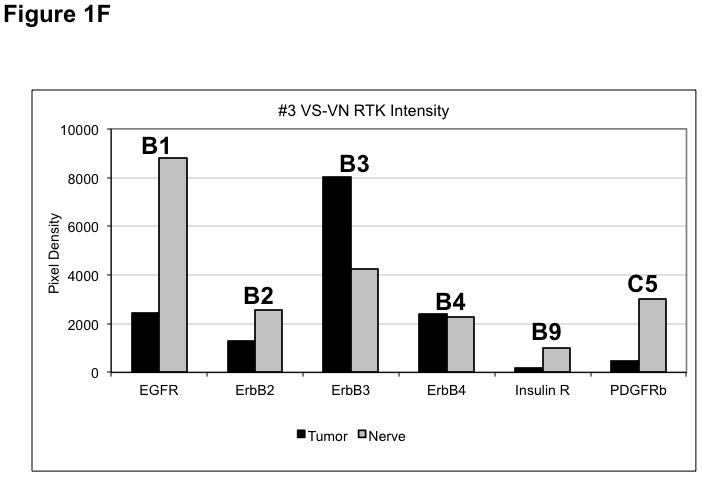
(A) VS tumor/vestibular nerve pair from patient #1 expressed multiple RTKs (boxes). (B) Densitometry analysis showed a marked increase in pixel density of ErbB2 (B2) and ErbB3 (B3) as well as other RTKs in the tumor. (C) VS tumor/vestibular nerve pair from patient #2 demonstrated increased expression of ErbB3, which was quantified by densitometry analysis (D). (E) A third VS tumor/vestibular nerve pair demonstrated increased activation of ErbB3 (B3) in the tumor, which was quantified by densitometry analysis (F).
