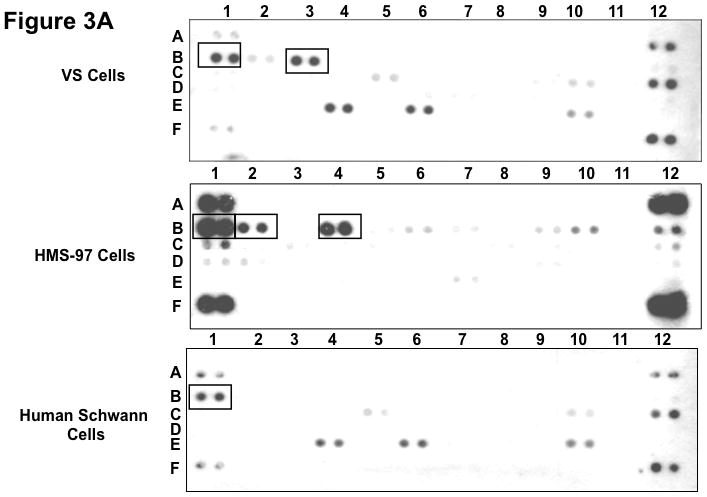
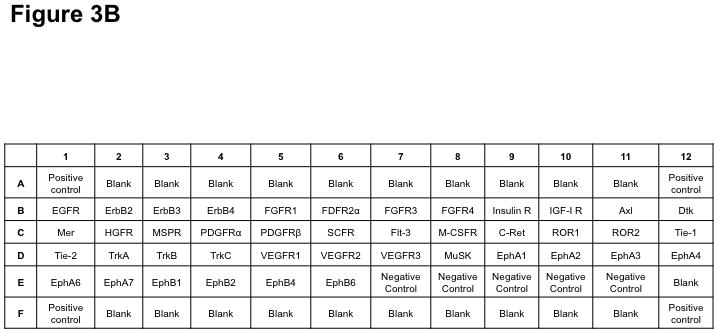
Figure 3. Phospho-RTK profiling in cultured schwannoma and Schwann cells.


Three primary VS cell cultures were established and used for preparing lysates for phospho-RTK array analysis according to Materials and Methods. A representative image of the array filter is shown. Normal Schwann cells were also prepared for the phospho-RTK array analysis and the image of the array filter is shown. Likewise, human malignant schwannoma HMS-97 cells were used in the analysis and the phospho-RTK expression file is shown (A). The coordinates for phospho-RTK’s are demonstrated (B).
