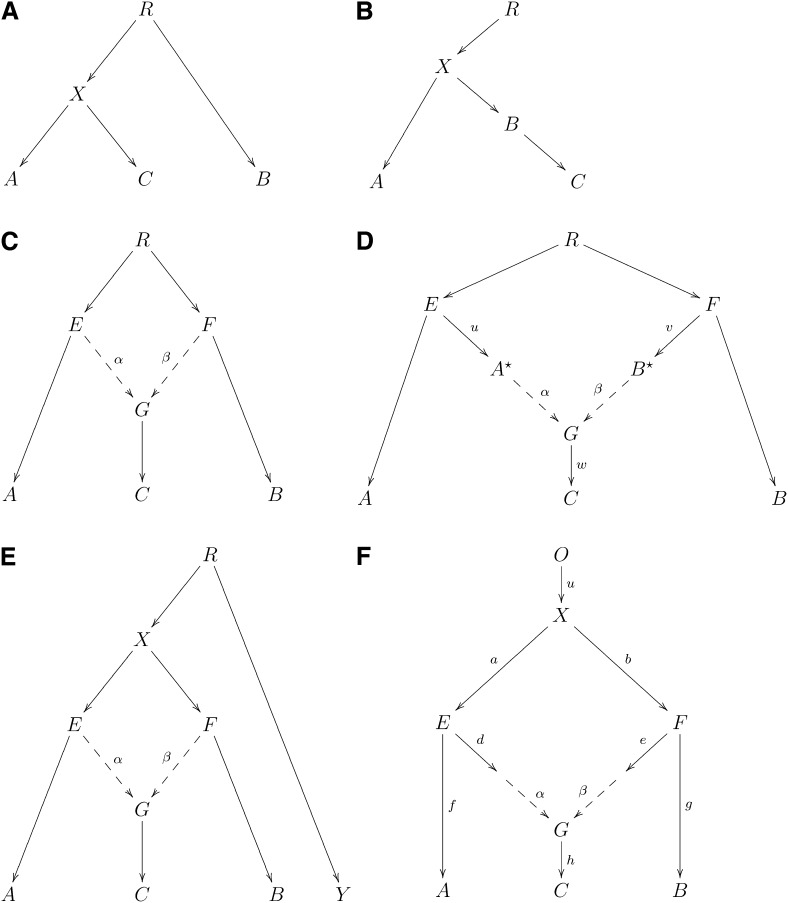
Figure 1 .
f-statistics: (A) A simple phylogenetic tree, (B) the additivity of branch lengths; the genetic drift between (A, B) computed using our f-statistic-based methods is the same as the sum of the genetic drifts between (A, B) and (B, C), regardless of the population in which SNPs are ascertained, (C) phylogenetic tree with simple admixture, (D) a more general form of Figure 1C, (E) example of an outgroup case, and (F) example of admixture with an outgroup.

