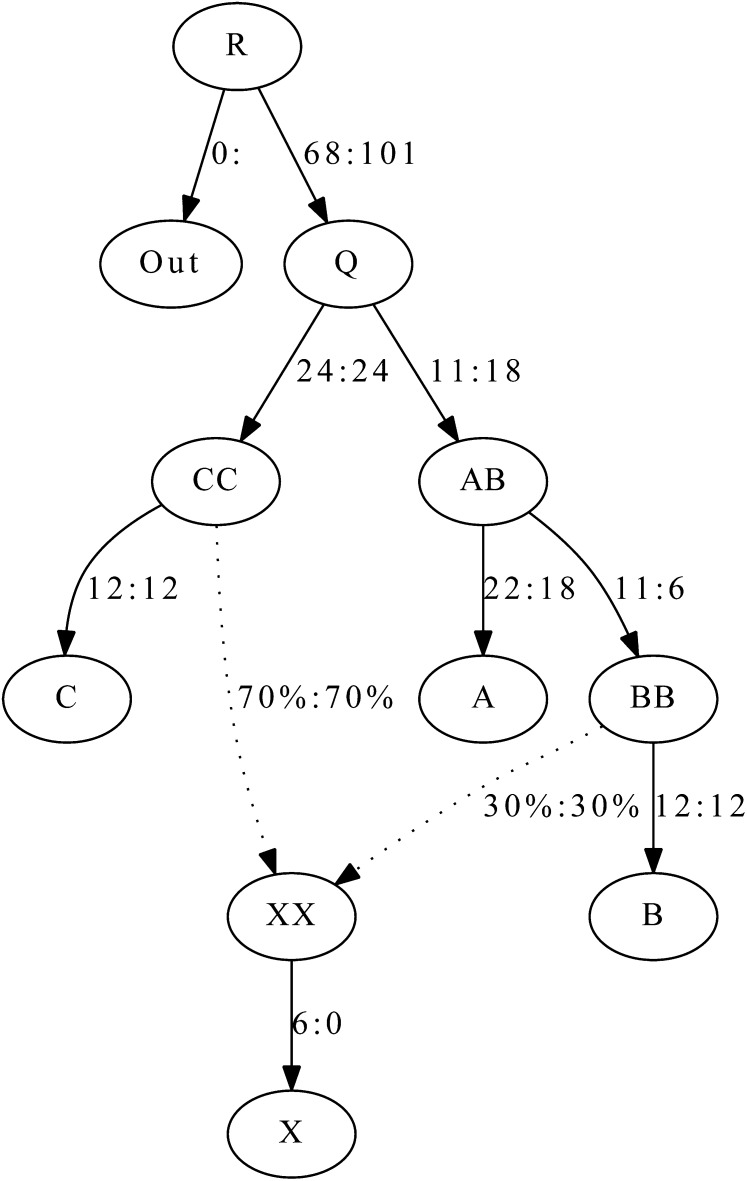
Figure 5 .
Admixture graph fitting: We show an admixture graph fitted by qpGraph for simulated data. We simulated 50,000 unlinked SNPs ascertained as heterozygous in a single diploid individual from the outgroup Out. Sample sizes were 50 in all populations and the historical population sizes were all taken to be 10,000. The true values of parameters are before the colon and the estimated values afterward. Mixture proportions are given as percentages, and branch lengths are given in units of Fst (before the colon) and f2 values (after). F2 and Fst are multiplied by 1000. The fitted admixture weights are exact, up to the resolution shown, while the match of branch lengths to the truth is rather approximate.

