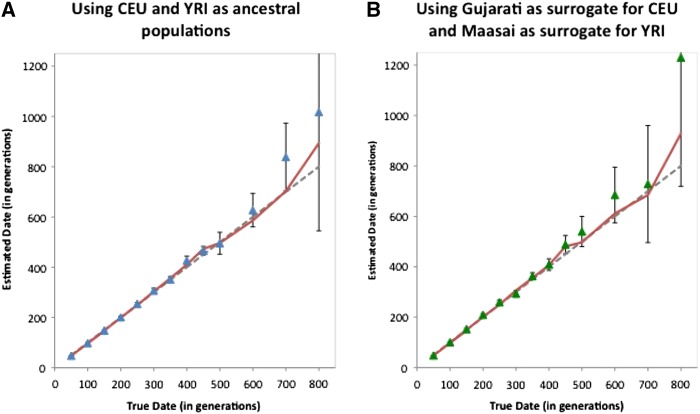
Figure 6 .
rolloff simulation results: We simulated data for 100 individuals of 20% European and 80% African ancestry, where the mixture occurred between 50 and 800 generations ago. Phased data from HapMap3 CEU and YRI populations was used for the simulations. We performed rolloff analysis using CEU and YRI (A) and using Gujarati and Maasai (B) as reference populations. We plot the true date of mixture (dotted line) against the estimated date computed by rolloff (points in blue A and green B). Standard errors were calculated using the weighted block jackknife. To test the bias in the estimated dates, we repeated each simulation 10 times. The estimated date based on the 10 simulations is shown in red.

