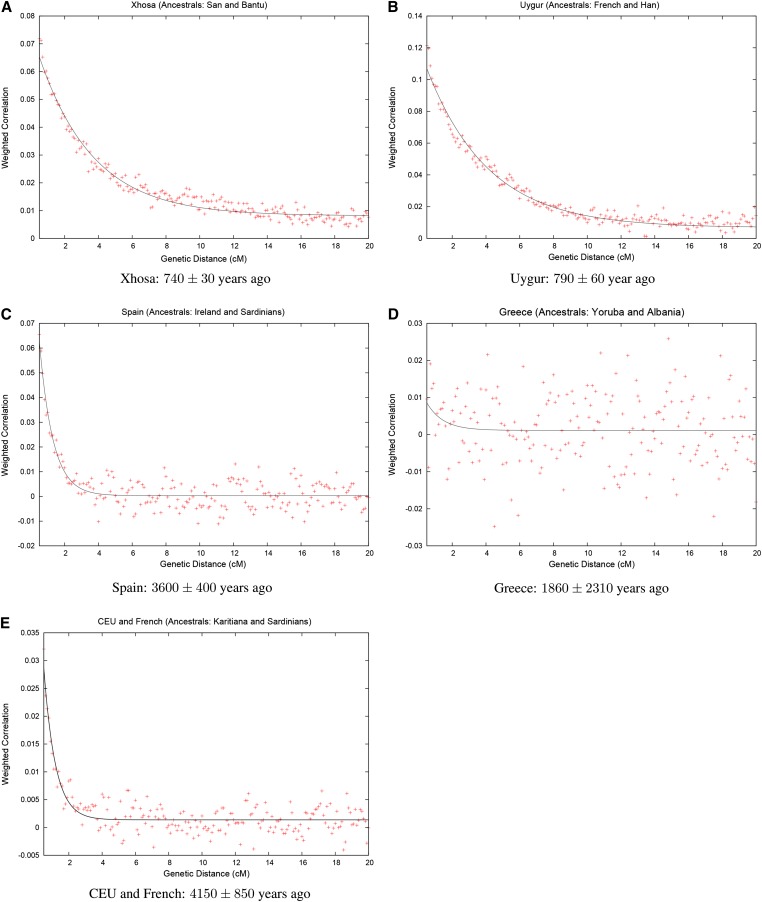
Figure 7 .
rolloff analysis of real data: We applied rolloff to compute admixture LD between all pairs of markers in each admixed population. We plot the correlation as a function of genetic distance for (A) Xhosa, (B) Uygur, (C) Spain, (D) Greece, and (E) CEU and French. The title of each includes information about the reference populations that were used for the analysis. We fit an exponential distribution to the output of rolloff to estimate the date of the mixture (estimated dates ±SE shown in years). We do not show inter-SNP intervals of <0.5 cM as we have found that at this distance admixture LD begins to be confounded by background LD.

