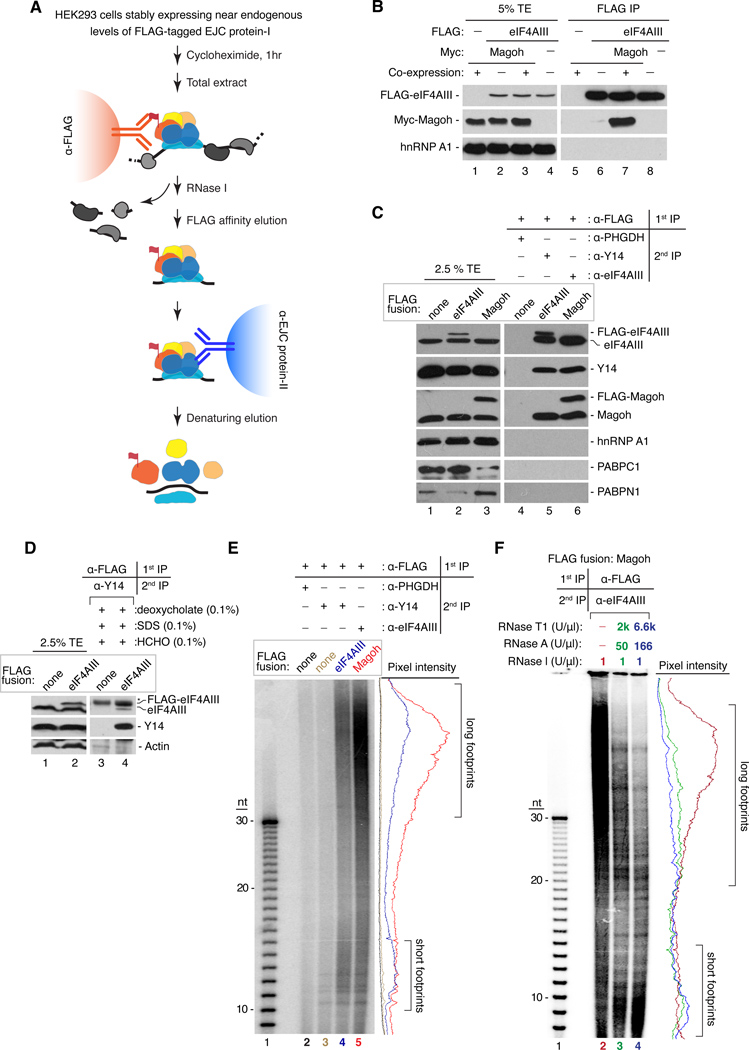
Figure 1. Purification of endogenous EJCs and RNA footprints.
A. RIPiT schematic. EJC core factors, colored; non-EJC proteins, gray; RNA, black line.
B. Co-purification of EJC factors requires their co-expression. Western blot of total extract (TE, lanes 1–4) or FLAG IPs (lanes 5–8) from extracts in which FLAG-eIF4AIII and Myc-Magoh were either co-expressed (+) or expressed in separate cells (−) and mixed prior to IP.
C. Confirmation of EJC purification. Western blots of EJC or non-EJC RNA-binding proteins in total extracts (lanes 1–3), control RIPiT (lane 4) or EJC RIPiTs (lanes 5 and 6). For each lane, indicated are the FLAG-fusion protein (box above) and antibodies used for the 1st and 2nd IPs (table above lanes 4–6).
D. EJC purification under denaturing conditions after formaldehyde crosslinking. Western blots as in C showing protein levels in total extracts (lanes 1 and 2) or RIPiTs (lanes 3 and 4) from formaldehyde-crosslinked cells. SDS and deoxycholate were included during the α-FLAG IP. * indicates IgGH.
E. Length distribution of RNase I-resistant EJC footprints. Base-hydrolyzed synthetic polyU30 RNA (lane 1) or immunoprecipitated RNA fragments from RIPiTs indicated at top (lanes 2–5) were 5′-end 32P-labeled and separated by denaturing PAGE.
Autoradiograph pixel intensity profiles of lanes 2–5 are at right.
F. Same as E except samples in lanes 3 and 4 were additionally incubated with RNases A+T1 after α-eIF4AIII IP.
See also Figure S1.

