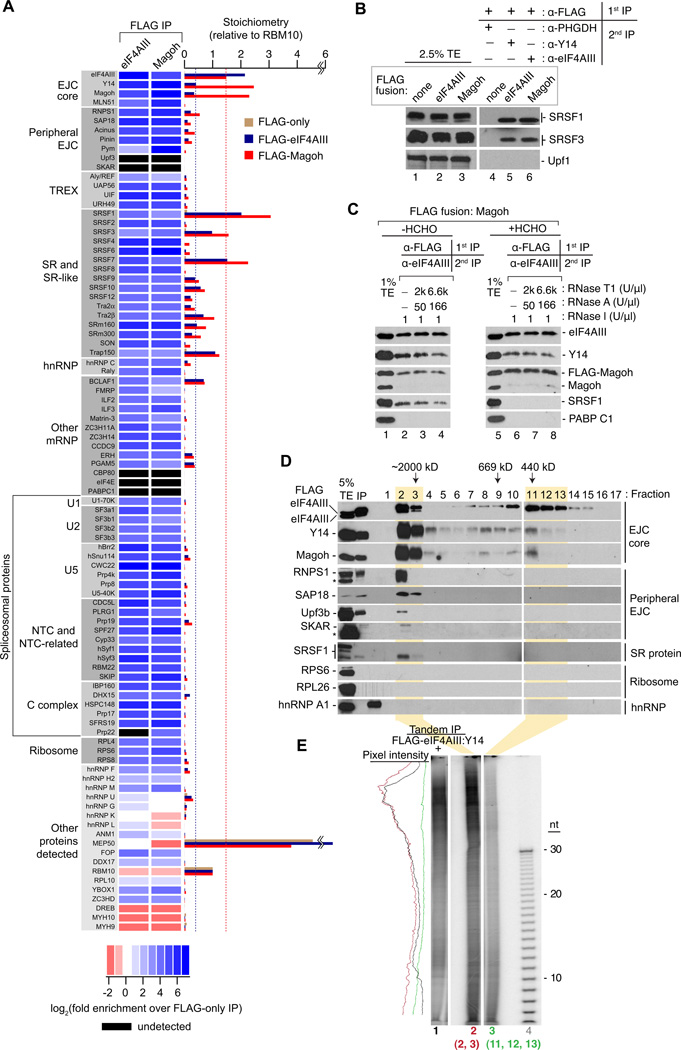
Figure 2. The EJC interactome.
A. The EJC proteome. Left: Protein names organized into indicated classes. Center: Heat map showing fold-enrichment of each protein in FLAG-eIF4AIII or FLAG-Magoh IPs over its level in a FLAG-only (control) IP (not shown). Black rectangles: protein not detected. All proteins shown were at least 10-fold enriched in FLAG-EJC protein IPs except in the “Other proteins detected” class, which includes <10-fold enriched RNA binding proteins, previously reported EJC-interacting proteins similarly enriched in our EJC and control IPs, and select proteins depleted in the EJC IPs compared to the control IP. Bottom: Heat map log2 color scale. Right: Bar graph showing protein stoichiometries relative to RBM10 in FLAG-eIF4AIII (blue), FLAG-Magoh (red) or FLAG-only (tan) IPs. Dashed blue line: level of co-purifying Y14 and Magoh in FLAG-eIF4AIII IP. Dashed red line: level of co-purifying eIF4AIII in FLAG-Magoh IP. These dashed lines assembled EJC core stoichiometries in each IP.
B. Confirmation of EJC proteomic analyses. Western blots of total extracts or RIPiTs as in Figure 1B showing levels of EJC-interacting factors either detected or not in mass spec analysis.
C. SRSF1 is tightly associated with but does not crosslink to EJC core factors. Western blots of indicated proteins in total extracts (lanes 1 and 5) or RIPiTs (lanes 2–4 and lanes 6–8). Native and denaturing α-FLAG IPs were as in Figure 1C and 1D, respectively.
D. Two distinct size complexes containing EJC core proteins. Western blots of indicated proteins (right) in total cell extract (TE), input FLAG-eIF4AIII IP sample (IP) and gel filtration fractions of RNase A-treated FLAG-eIF4AIII complexes (lanes 1–17). Peak elution fractions of known MW size markers are indicated at top. * indicates IgGH (RNPS1 panel) or a cross-reacting unknown protein (SKAR panel).
E. RNA footprints of EJC-core containing complexes. Autoradiogram as in Figure 1D showing RNA profiles from FLAG-eIF4AIII:Y14 RIPiT (lane 1) or from indicated gel filtration fractions in C (lane 2: fractions 2 and 3; lane 3: fractions 11, 12 and 13). Pixel intensity profile is on the left.

