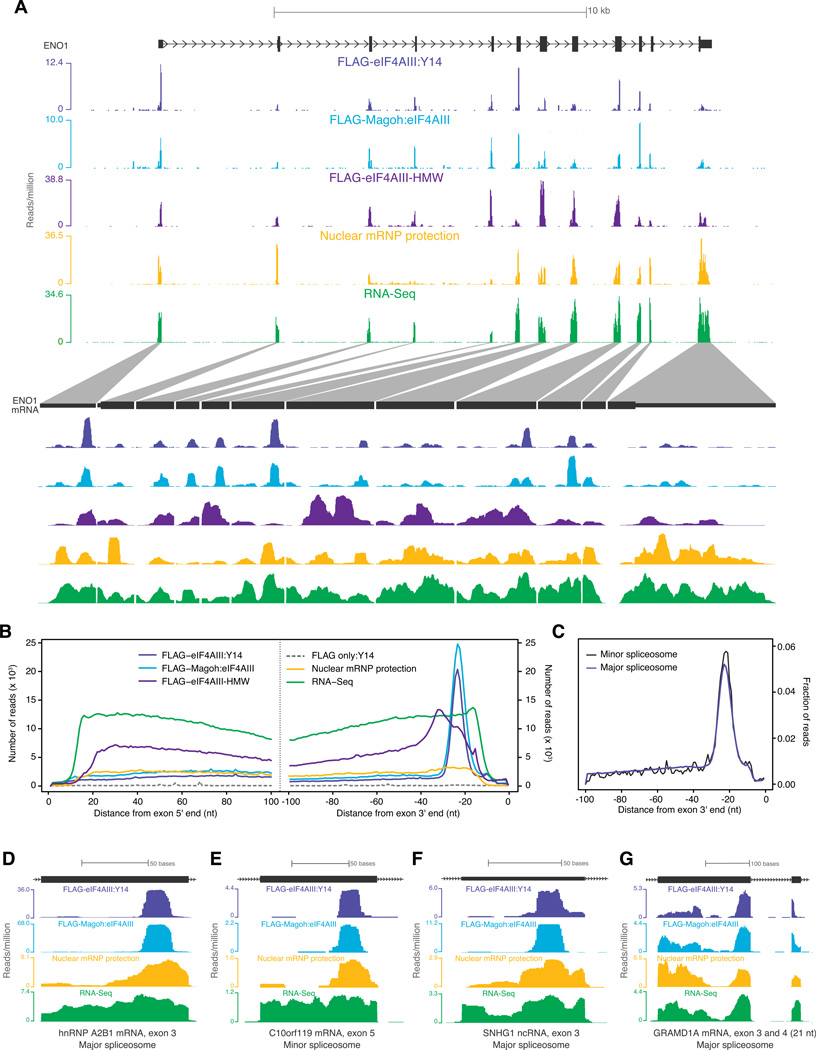
Figure 3. EJC occupancy on endogenous mRNAs.
A. Distribution of short EJC footprints (FLAG-eIF4AIII:Y14 and FLAG-Magoh:eIF4AIII), HMW EJC footprints (FLAG-eIF4AIII-HMW), nuclear mRNP footprints or RNA-Seq reads on a representative gene (top half), ENO1, and its spliced mRNA (bottom half). Scale is indicated at top; reads per million at the highest position within each library window are indicated at left.
B. Meta-exon analysis of read distribution. Composite plots of distances from the centers of all exon-mapping reads to the 5′ (left panel) or 3′ end (right panel) of each read's parent exon for the indicated libraries.
C. Meta-analysis of exons upstream of major or minor spliceosome introns. Composite plots for FLAG-Magoh:eIF4AIII library reads mapping to exons upstream of introns excised by the “major” (~1.7×10⁵ introns) or “minor” (427 introns) spliceosome. In both plots, the fraction of reads at each nucleotide position out of all reads within 100 nt from exon 3′ end was plotted.
D-G. Profiles of short EJC footprints, nuclear mRNP footprints and RNA-Seq reads (as in A) on individual exons. Distinguishing features of each exon are indicated at bottom.
See also Figure S3.

