
Figure 7. Cytokine abnormalities in Rgs16–/– mice inoculated with S. mansoni.
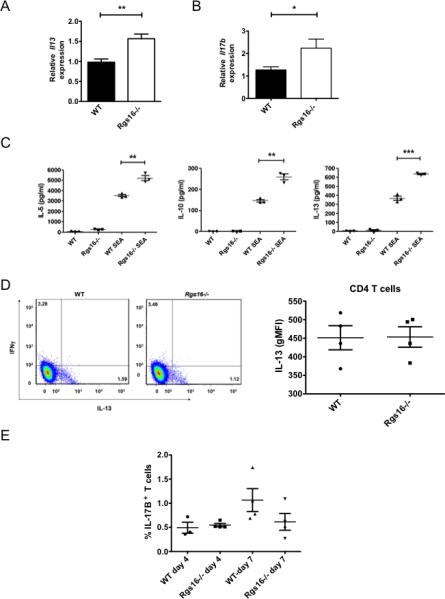
(A-B) Expression of Il13 (A) or Il17b (B) was evaluated in naïve or helminth-challenge lungs by real-time PCR (*P = 0.03; **P = 0.005, unpaired t-test). (C) Cells were harvested from lung-draining mediastinal LNs 7 days following inoculation with S. mansoni. Cells were left untreated or re-stimulated with Schistome egg Ag (SEA) for 3 days followed by measurement of the indicated cytokine levels in supernatants (*P = 0.005; ***P =0.0001, unpaired t-test). (D) Frequencies of IL-13+ or INFγ+ T cells (CD3+) in LNs 7 days following S. mansoni challenge were quantified by means of flow cytometry Numbers in each quadrant represent percentage of total T cells. Graph on the right shows intensity of IL-13 staining (geometric mean fluorescence intensity, MFI) in the CD4 T cell population. (E) Frequencies of IL-17B+ T cells (CD3+) in LNs 4 or 7 days following S. mansoni challenge were quantified by means of flow cytometry. All data was generated using 3 naïve mice/ group, 3-5 challenged WT mice or 4-5 challenged Rgs16-/- mice. For (C), data is representative of 7-8 mice/group evaluated in 2 independent experiments.