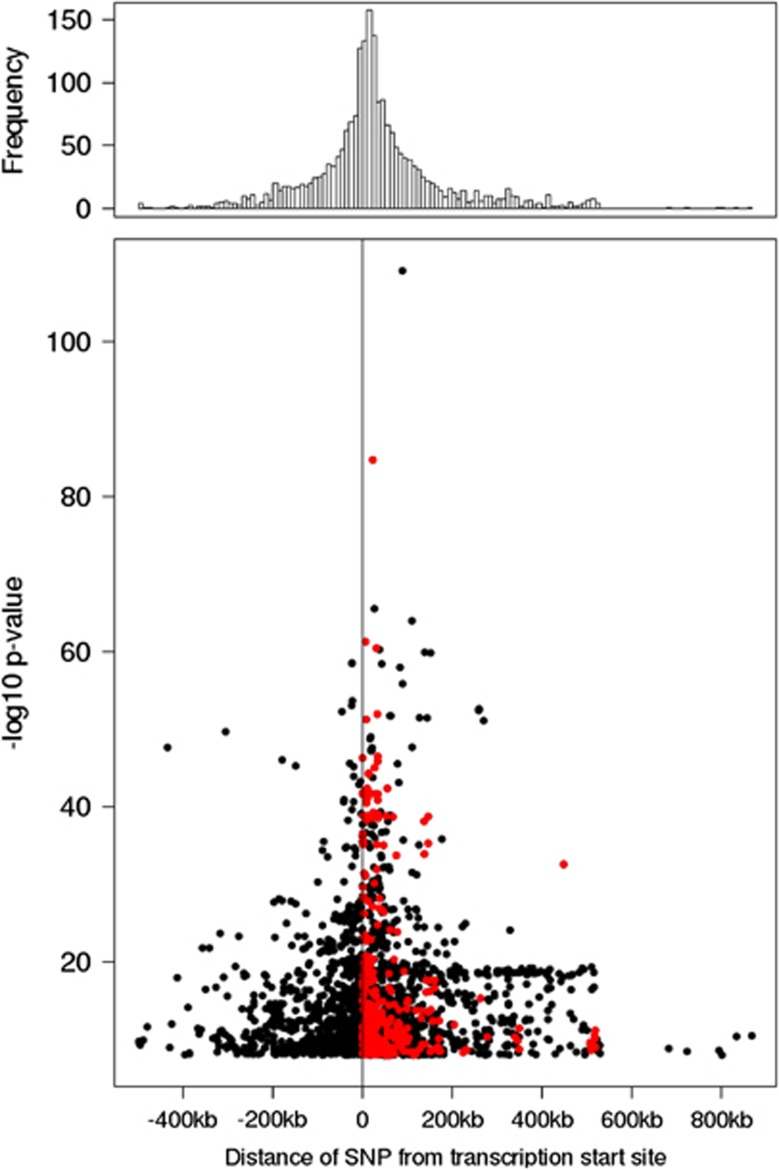
Figure 2.
Plot of distance of the SNP from the transcriptional start site (TSS) of the cis transcript in the KORA F3 discovery cohort. Histogram (10 kb window) and scatter plot of the eQTL distribution in KORA F3 discovery cohor,t depicting the distance of SNP from the TSS of the cis transcript. The red dots indicate SNPs located within the transcript.

