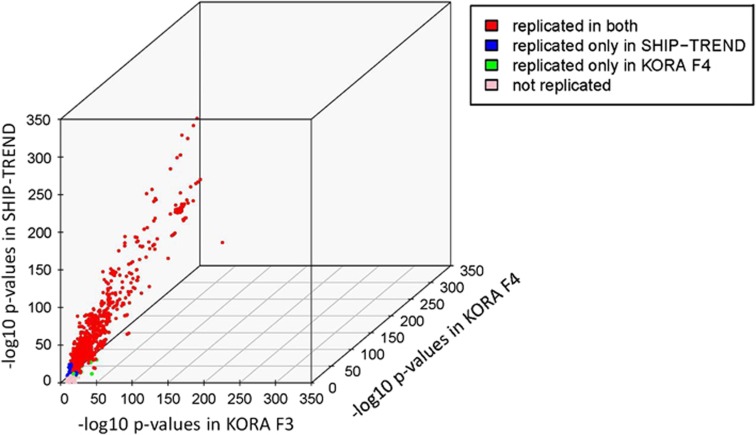
Figure 4.
3D Scatter plots of eQTL P-values in the discovery and replication cohorts. 3D scatter plots of P-values of all KORA F3 discovery cohort eQTLs versus P-values of KORA F4 and SHIP-TREND replication cohorts at the Bonferroni threshold of significance (P=1.03 × 10⁻⁸ for cis and P=3.6 × 10⁻¹² for trans). Red dots indicate eQTLs replicated in both KORA F4 and SHIP-TREND, blue dots indicate QTLS replicated only in SHIP-TREND and green dots indicate eQTLs replicated only in KORA F4. The pink dots indicate eQTLs that could not be replicated.

