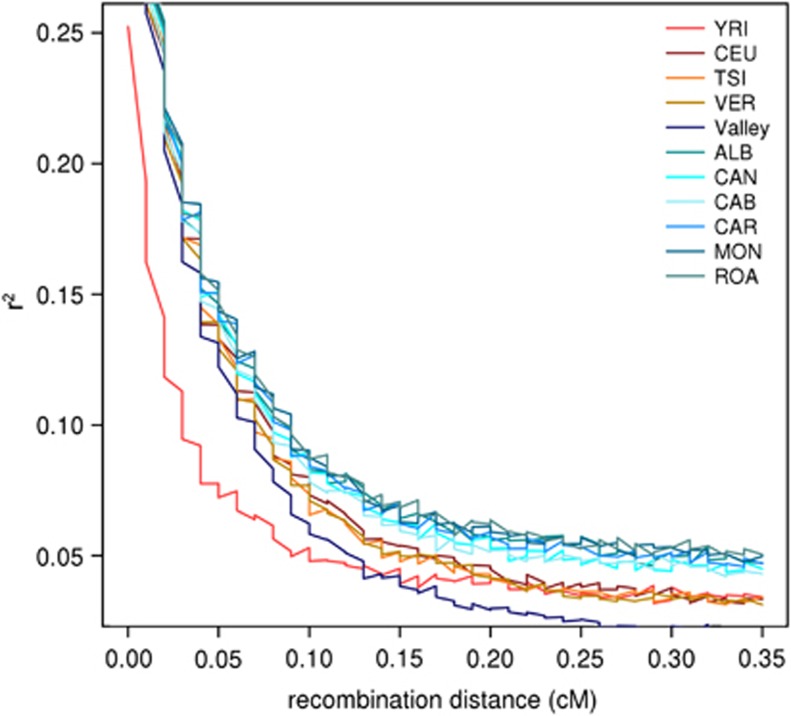
Figure 3.
Decay of LD with increasing recombination distance measured as average r2 within recombination distance bins. As expected the population with faster decay is the YRI, whereas on the opposite villages show slower decay. The trend is inverted for the valley meta-population (dark blue) that is even faster than the YRI at recombination distances >0.15 cM.

