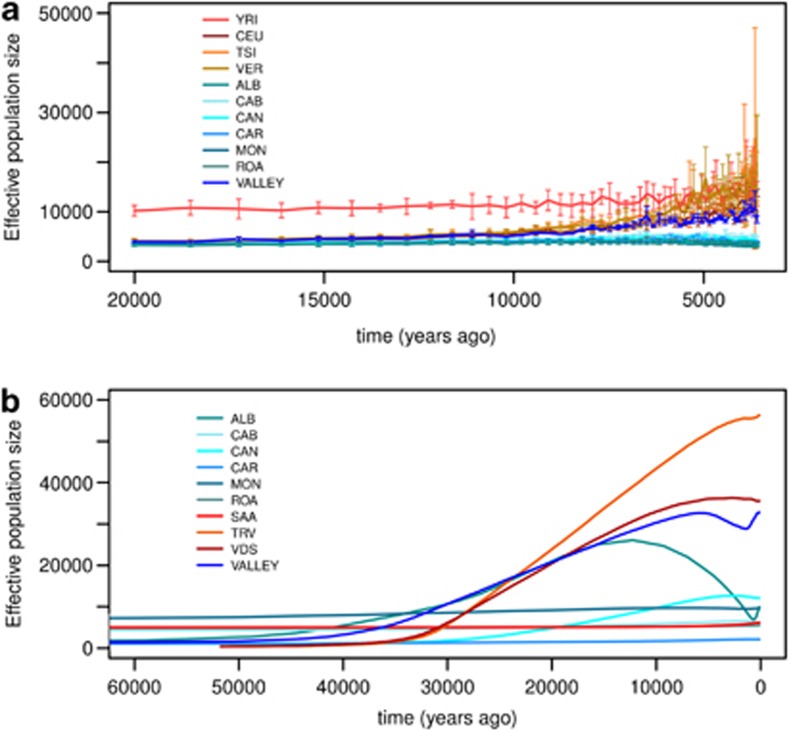
Figure 4.
Estimates of effective population sizes. Upper graph (a) shows estimates from nuclear DNA in the last 20 000 years. Notably, villages have the lowest values of Ne and there is no signature of the recent population expansion as in the reference populations. An opposite trend is visible for the valley sample (dark blue). Finally, YRI shows a constant trend and the highest effective population size, in agreement with other estimates as mentioned in the main text. A similar trend is shown when considering estimates from mtDNA (b) data. However, given the different properties of mtDNA and the different methods we used with respect to nuclear DNA, the two estimates are not directly comparable.

