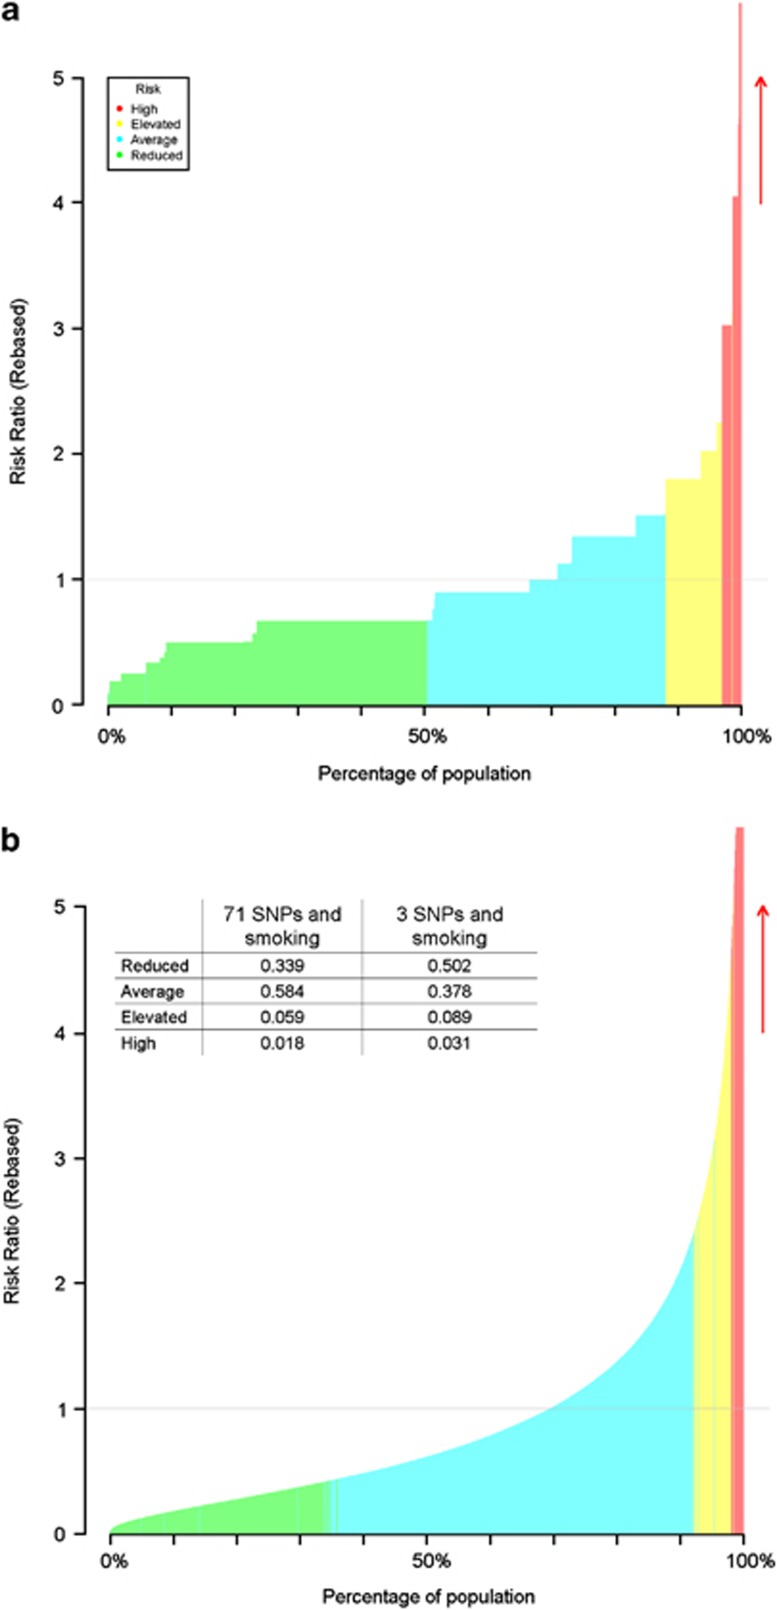
Figure 1.
Population risk distribution (REGENTmodel) of Crohn's disease using (a) 3 SNPs and (b) 71 SNPs, and one environmental factor (smoking). Shading indicates the risk combinations classified as of average risk (blue), reduced risk (green), elevated risk (yellow) and high risk (red), and the proportion of the population in each category is tabulated.

