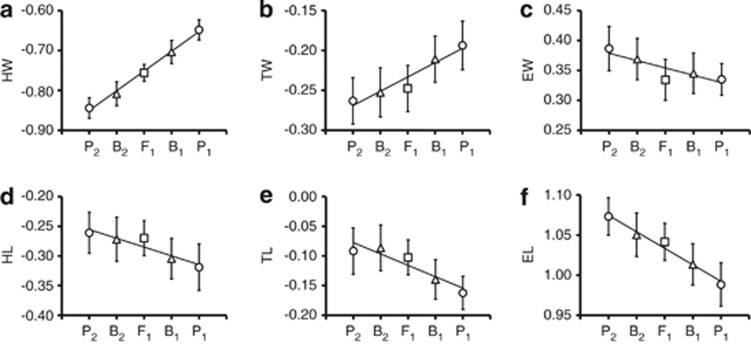
Figure 2.
Means and standard deviations of the measured traits of each of the five populations. Solid lines represent linear regressions of mean values. HW, head width (a); HL, head length (d); TW, thorax width (b); TL, thorax length (e); EW, elytron width (c); EL, elytron length (f). The symbols of circles, squares, and triangles indicate the mean values of parental, F1, and backcross populations, respectively.

