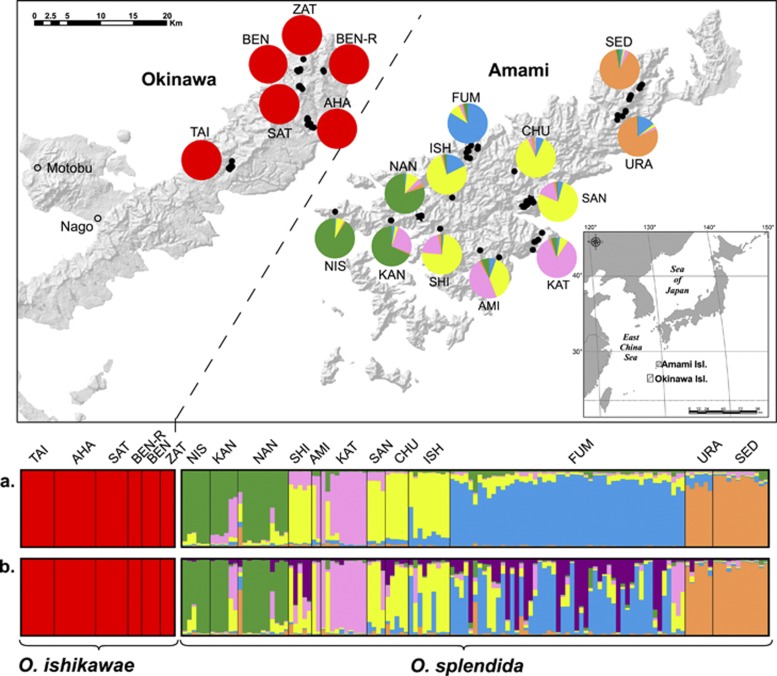
Figure 1.
Sampling localities of O. ishikawae (Okinawa Island) and O. splendida (Amami Island) and assigned genetic clusters from STRUCTURE. Map: sampling sites of individuals are indicated with solid circles on the shaded leaf maps of each island. Abbreviations are listed in Table 1. Colored pie charts show the total ratios of assigned genetic clusters of individuals in each population from STRUCTURE 2.3.3 (Hubisz et al., 2009) using the admixture model with the LOCPRIOR option. Color scheme: Graphical output of assigned genetic cluster from STRUCTURE 2.3.3. Each vertical bar represents an individual, and bars are divided into proportions of assigned genetic clusters based on (a) the admixture model with the LOCPRIOR option and (b) the admixture model without any priors.

