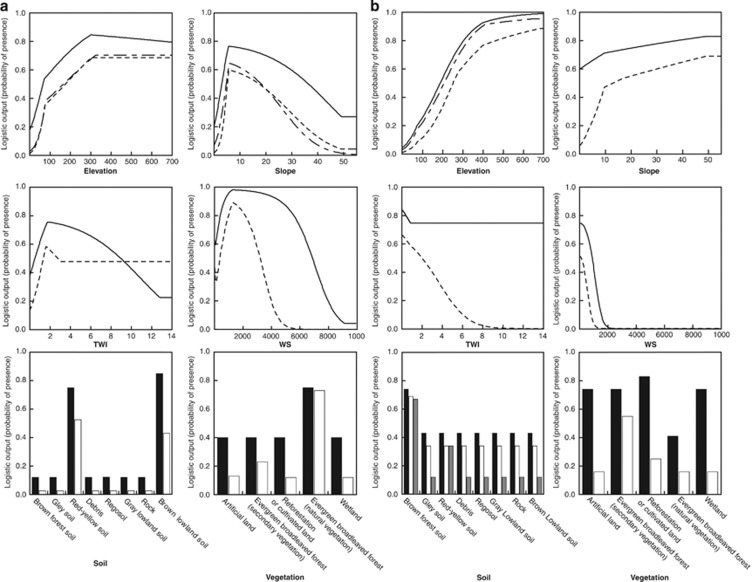
Figure 2.
Assigned probabilities of the presence for each environmental variable. The graphs show assigned probabilities for six environmental variables [elevation, slope, TWI, watershed (WS), soil and vegetation] in MAXENT V3.3.1 (Phillips et al., 2006) for (a) O. ishikawae and (b) O. splendida. Solid, dashed and dash-dot lines indicate the probabilities in full models using all six variables, models using only a single variable, and best-fitting models explaining population structures, respectively. Black, white and gray rectangles in bar graphs also indicate the probabilities in full models, models with a single variable and best-fitting models, respectively.

