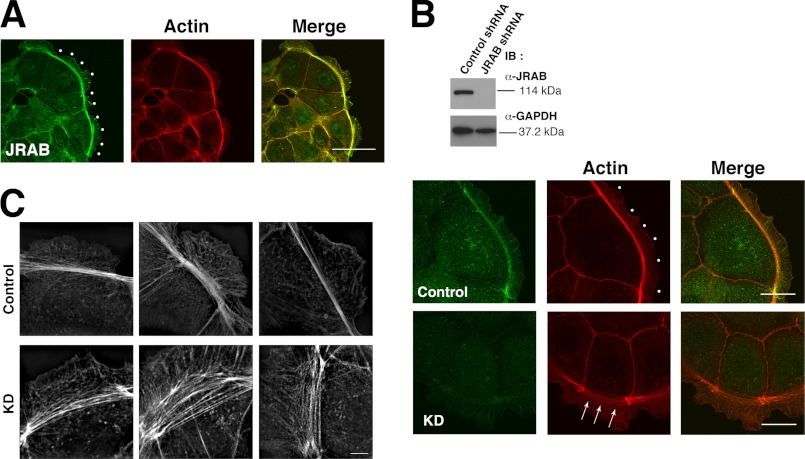
FIGURE 4.
Effect of JRAB on the actin bundle along the free border in MTD-1A cells. A, localization of JRAB at the free border (dots). Bar, 50 μm. B, effect of JRAB knockdown on the actin bundle along the free border. Top panel, expression levels of JRAB and GAPDH in the cells. Bottom panel, confocal microscopic image of the actin bundle along the free border (arrows and dots) in JRAB-knockdown and control cells. IB, immunoblotting. Bar, 20 μm. C, super-resolution image of the actin bundle along the free border in JRAB-knockdown and control cells. Bar, 5 μm. The results shown are representative of at least three independent experiments.

