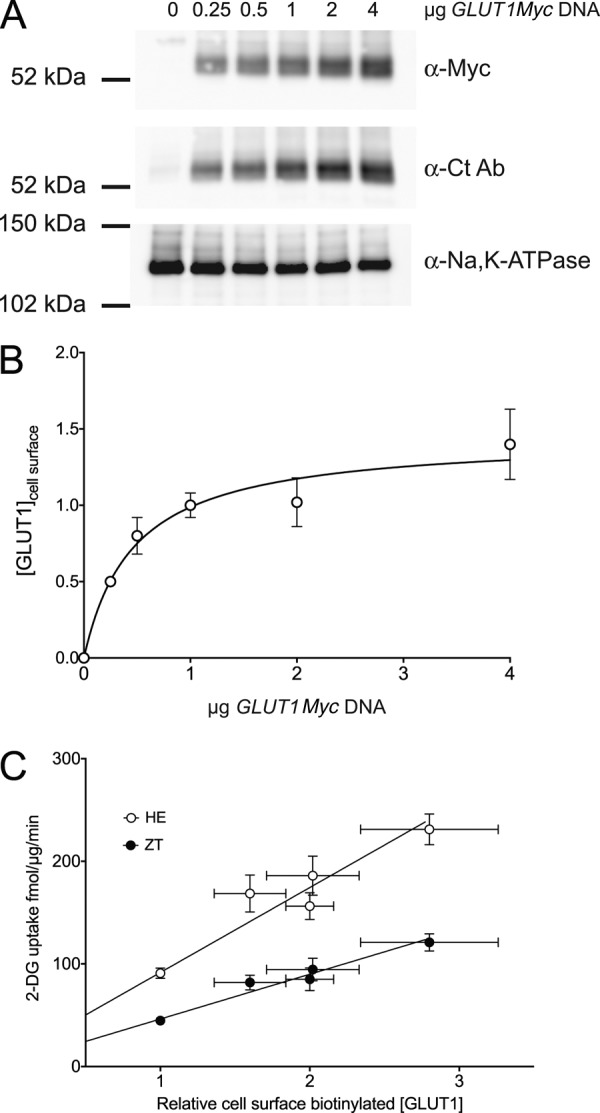
FIGURE 4.

The effect of GLUT1Myc cell surface expression on transport rates and hetero-exchange transport. A, HEK cells were transfected with varying [GLUT1myc DNA]. Two days later, cell surface proteins were biotinylated, solubilized, and affinity purified on streptavidin beads, and GLUT1Myc was detected by immunoblot analysis using either α-Myc Ab or α-Ct Ab. As a loading control, the α-subunit of the Na,K-ATPase was detected using α-Na,K-ATPase Ab. The mobility of molecular weight standards is indicated. The amount of GLUT1myc DNA added at transfection is shown above the blots. B, data obtained in the above experiment and from two similar experiments were analyzed by densitometry, background corrected, normalized to loading controls, and averaged. Ordinate, relative cell surface [GLUT1]; abscissa, μg of DNA added at transfection. The curve is a section of a single rectangular hyperbola characterized by K0.5 = 0.47 ± 0.13 μg of DNA; maximum expression = 1.45 ± 0.12 with expression normalized to unity at 1 μg of DNA. C, rate of GLUT1Myc-catalyzed zero-trans (●) and hetero-exchange (○) 2-DG uptake as a function of cell surface [GLUT1Myc] as detected by cell surface biotinylation. Cells were transfected with GLUT1myc DNA as described in the legend to Fig. 4A, and measurements of ZT and HE 2-DG uptake or cell surface [GLUT1Myc] were made in triplicate on 3 separate occasions. Uptake measured in mock-transfected cells was subtracted. Results are shown as mean ± S.E. The lines drawn through the points were computed by the method of least squares and have the following parameters: ZT, slope = 43.7 ± 2.8 fmol/μg/min/unit biotinylation, y intercept = 2.6 ± 5.1 fmol/μg/min, R2 = 0.98; hetero-exchange, slope = 82.8 ± 8.5 fmol/μg/min/unit biotinylation, y intercept = 8.8 ± 15.3 fmol/μg/min, R2 = 0.96.
