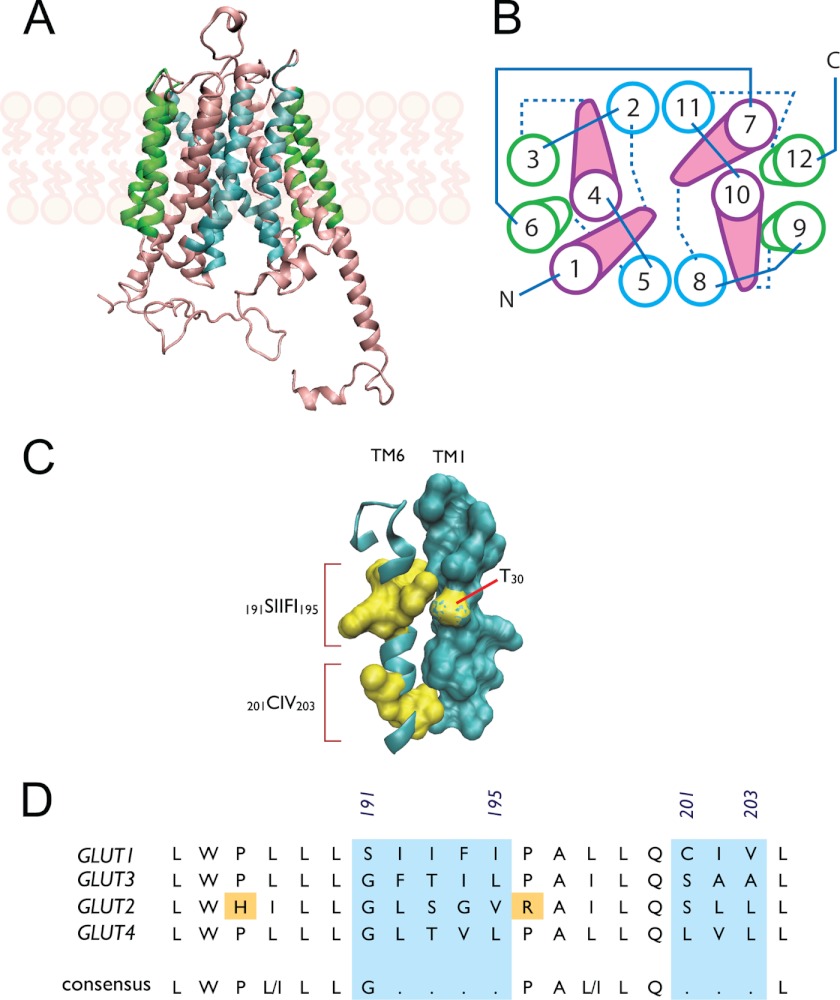
FIGURE 8.
Role of TM6 in GLUT1-mediated trans-acceleration. Putative glucose transport proteins (GLUT1) homology-modeled structure based on the GlpT homology model (26) and visualized using VMD 1.8.5 (University of Illinois 2006). GLUT1 coordinates were obtained from the RCSB Protein Data Bank (entry 1SUK). A, GLUT1 viewed along the bilayer plane. The limits of the bilayer are indicated by the schematic representations of phospholipids. B, putative helix packing arrangement viewed from the cytoplasmic surface. TMs are numbered and colored as in A. Cytoplasmic loops are indicated by solid lines and exofacial loops by dashed lines. C, putative stacking of TMs 6 and 1. TM6 is shown as a ribbon schematic (cyan) and residues 191–195 and 201–203 as surface representations (yellow), respectively. TM1 is shown as a surface representation (cyan), with residue Thr-30 highlighted (yellow). D, sequence alignment of TM6 from human GLUTs 1, 3, 2, and 4. GLUTs 1 and 3 catalyze transacceleration, whereas GLUTs 2 and 4 do not. Numbering corresponds to GLUT1 sequence; the areas lacking homology are shaded cyan. A putative consensus sequence is indicated.

