FIGURE 5.
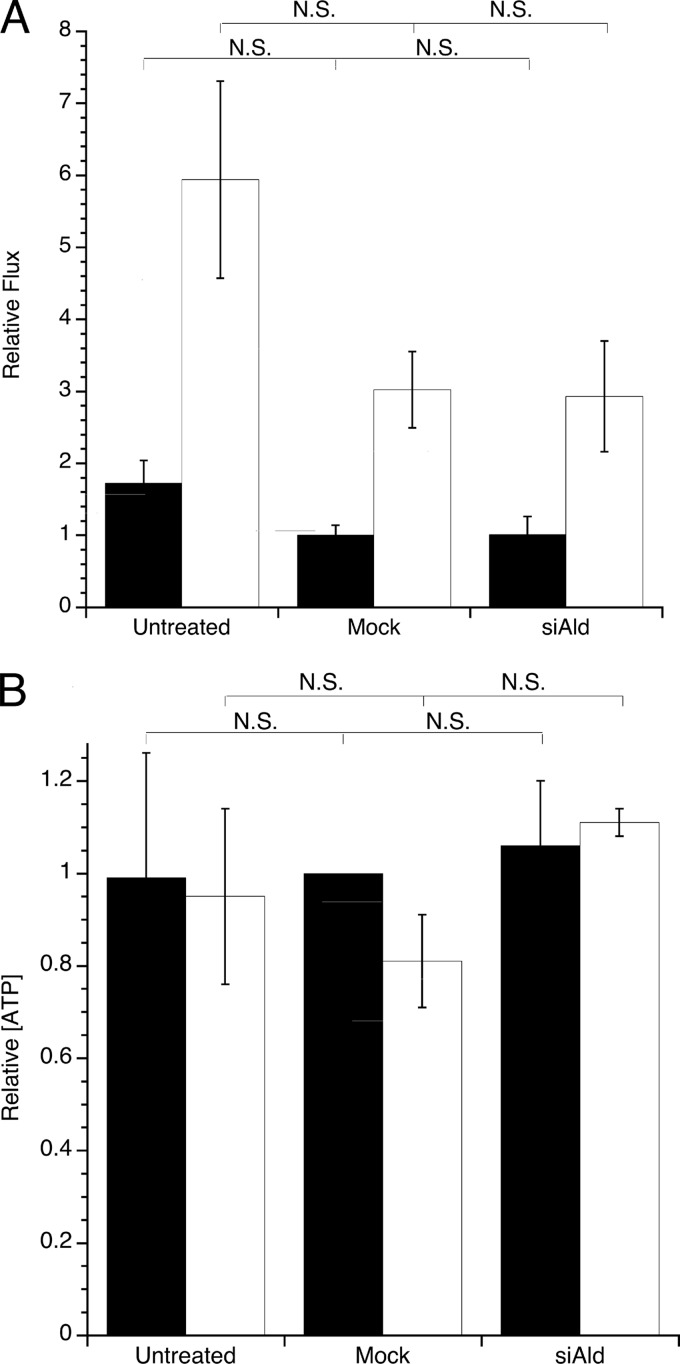
Glycolytic flux and intracellular ATP concentrations in aldolase siRNA-transfected Ras-3T3 cells. A, glycolytic flux was measured in NIH-3T3 (black) and Ras-3T3 (white) cells that were untreated, mock-transfected, or aldolase siRNA (siAld)-transfected using the rate of lactate production per cell. Values were normalized to NIH-3T3 mock-transfected treatment values (average 1.84 ± 0.17 × 10⁻⁷ μmol/h·cell). Error bars are represented as S.E. No significant differences were seen among any of the treatments within one cell type. B, intracellular [ATP]/cell was measured using a bioluminescence assay in NIH-3T3 (black) or Ras-3T3 (white) cell lysates after treatment as described in A. Values are normalized to NIH-3T3 mock-transfected treatment values (average value 0.1 fmol/cell). Error bars are represented as S.E. No significant differences were seen among any of the treatments within one cell type.

