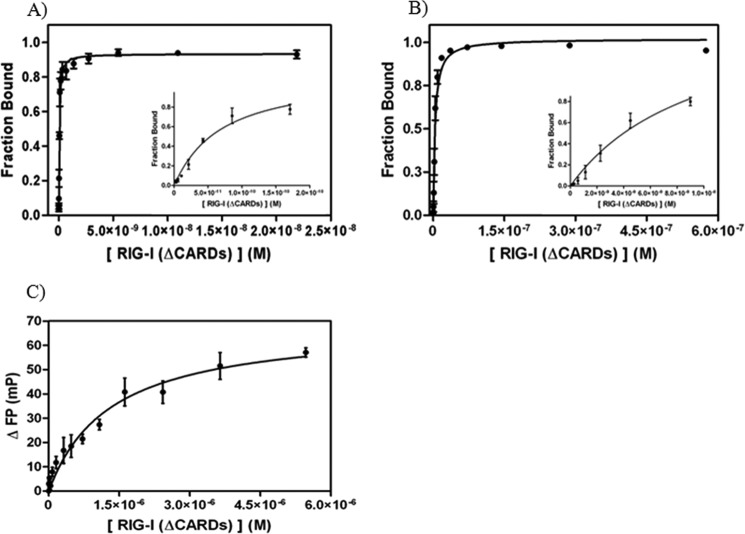
FIGURE 3.
Binding analysis of RIG-I (ΔCARDs) to 14 dsRNA and ssRNA substrates. A, binding curve of RIG-I (ΔCARDs) to 5′-ppp 14 dsRNA (Kd = 0.041 ± 0.002 nm; R2 = 0.98). RIG-I (ΔCARDs) concentrations used in experiments are 3, 5, 10, 20, 40, 85, 170, 340, 680, 1400, 2700, 5500, 11,000, and 22,000 pm. The dsRNA concentration in the reactions is 10 pm. B, binding curve of RIG-I (ΔCARDs) to 5′-OH 14 dsRNA (Kd = 3.6 ± 0.9 nm; R2 = 0.98) determined by EMSA data. RIG-I (ΔCARDs) concentrations used in experiments are 0.070, 0.140, 0.280, 0.560, 1, 2, 5, 9, 18, 36, 72, 140, and 290, and 580 nm. The dsRNA concentration in the reactions is 0.5 pm. Insets, data for the five to six lowest protein concentrations of the respective plots. To evaluate whether the radioactive label on the 5′ terminus of the complementary strand influences RIG-I binding affinity to the substrates, a radioactive binding competition assay with unlabeled 5′-OH dsRNA was conducted and found to be almost identical (KI = 13 nm; data not shown). C, binding curve of RIG-I (ΔCARDs_238aa) to 12-mer ssRNA (Kd = 1.3 ± 0.2 μm; R2 = 0.95) determined by FP. The protein concentrations used in the experiments are 5, 10, 20, 40, 80, 160, 320,480, 720, 1080, 1620, 2430, 3650, and 5470 nm. Note that the data in C were obtained with a slightly shorter RIG-I construct than described under “Experimental Procedures.” This construct contains the same RNA-binding domains as RIG-I (ΔCARDs) and binds dsRNA with similar affinity (17 ± 9 nm; data not shown).

