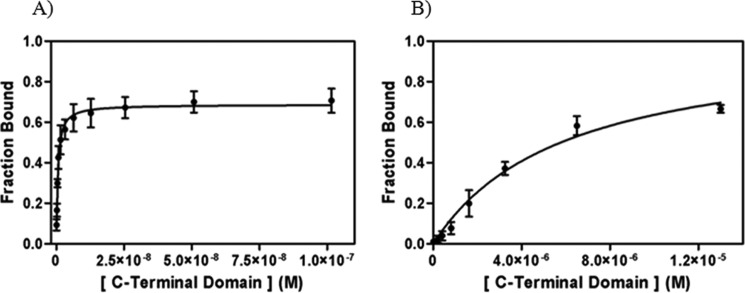
FIGURE 5.
Binding analysis of CTD to 14 dsRNA substrates. A, binding curve of CTD with 5′-ppp 14 dsRNA (Kd = 0.500 ± 0.060 nm; R2 = 0.95). B, binding curve of CTD with 5′-OH 14 dsRNA (Kd = 5900 ± 750 nm; R2 = 0.98) determined by EMSAs. The CTD concentrations for experiments with 5′-ppp 14 dsRNA are 0.100, 0.200, 0.400, 0.800, 1.5, 3, 6, 13, 25, 51, 102 nm. The CTD concentrations for experiments with 5′-OH 14 dsRNA are 13, 25, 50, 100, 200, 410, 810, 1630, 3250, 6500, 13,000 nm. The dsRNA concentration in the reactions is 0.1 nm.

