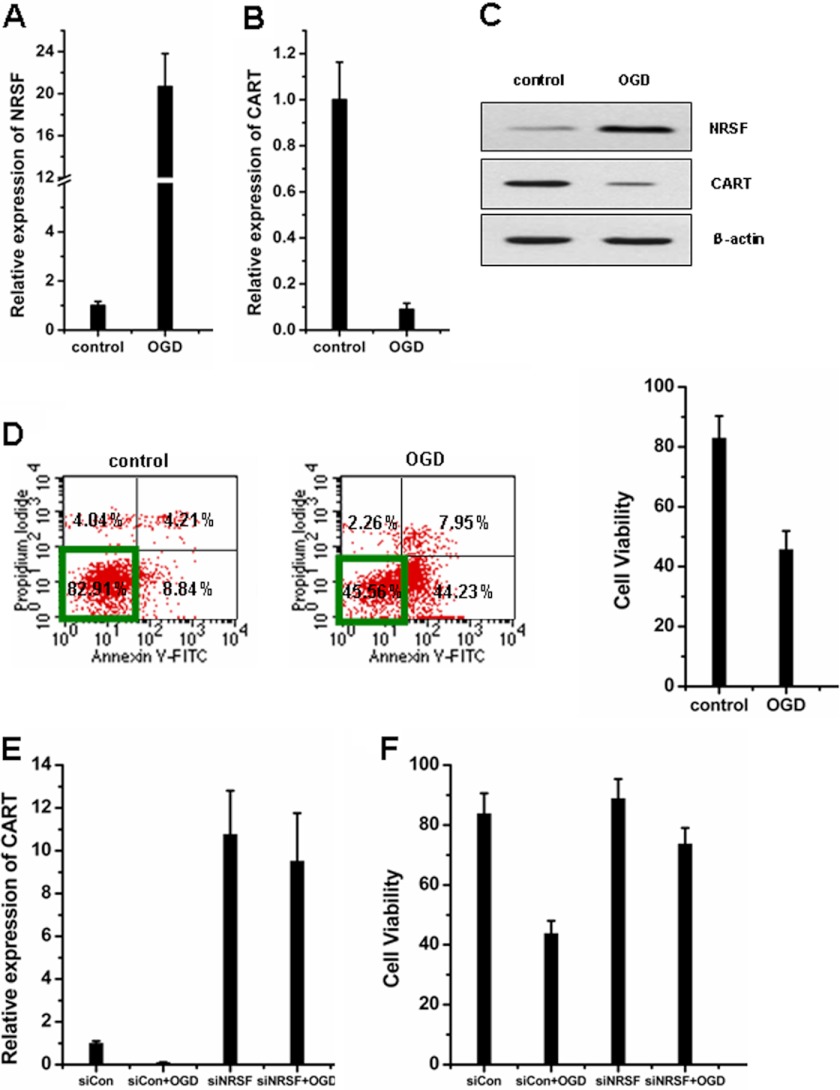
FIGURE 7.
OGD-mimicked hypoxia-ischemia up-regulates NRSF to repress CART and induce cell death. A and B, SK-N-SH cells were exposed to OGD for 3 h and then reoxygenation at 37 °C for 24 h. The expression levels of NRSF (A) and CART mRNA (B) were monitored by qPCR. C, Western blot was used to detect the protein levels of NRSF and CART. D, cell death was assessed by Annexin-V and PI labeling and flow cytometric analysis. Quadrant 1 (upper left), late necrosis; quadrant 2 (upper right), early necrosis/late apoptosis; quadrant 3 (lower left), live cells; quadrant 4 (lower right), early apoptosis. Cells unstained for Annexin V-FITC and PI are defined as viable cells. E and F, NRSF-depleted SK-N-SH cells were exposed to OGD and then reoxygenation. CART mRNA levels (E) and cell viability (F) were measured. Data in A and B and D–F are mean ± S.D. (n = 3). Each independent experiment was carried out in triplicate.

