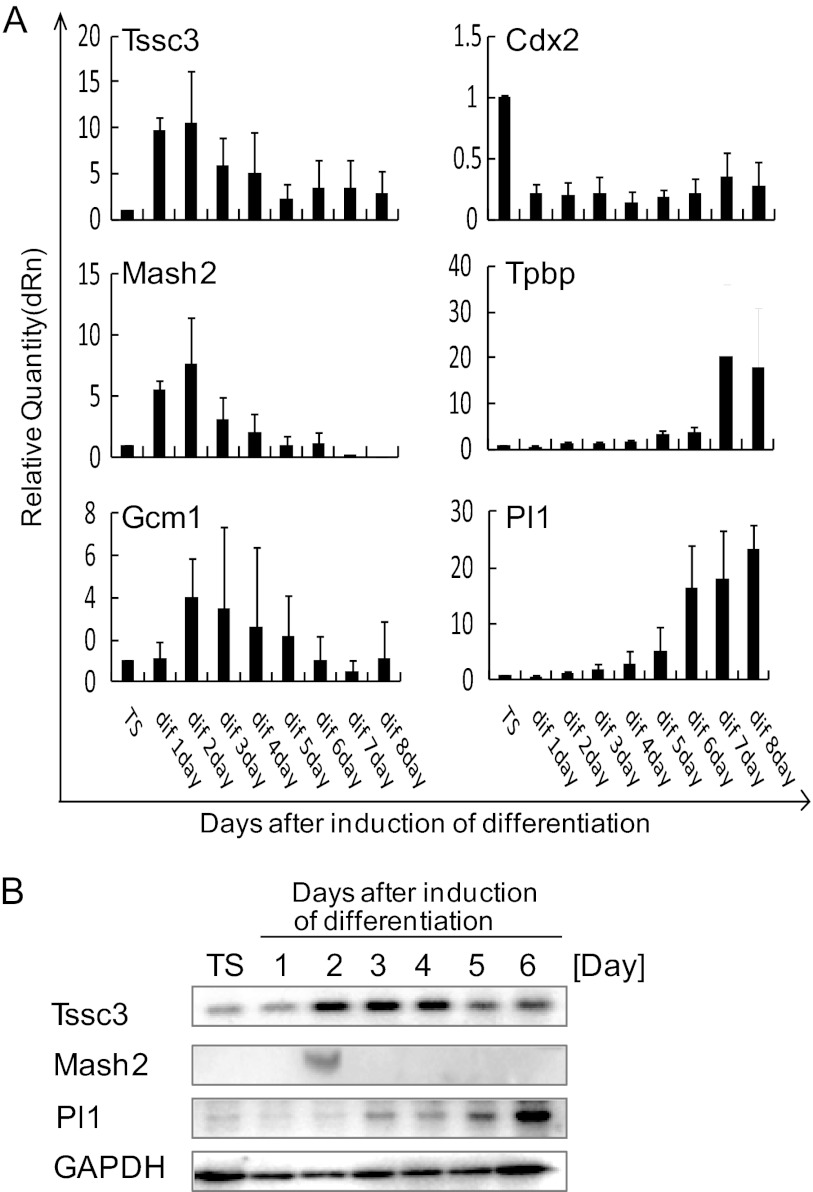
FIGURE 1.
TSSC3 is expressed in mouse TS cells and differentiated cells. A, TSSC3 and trophoblast markers were analyzed by real-time PCR using cDNA, which was reverse-transcribed from total RNA samples. The mRNA levels were normalized using β-actin. Results are the mean ± S.D. (error bars) from three independent experiments. B, alterations in TSSC3, MASH2, and PL1 protein levels after the withdrawal of FGF/CM. GAPDH is provided as a loading control. Results from three independent experiments are shown.

