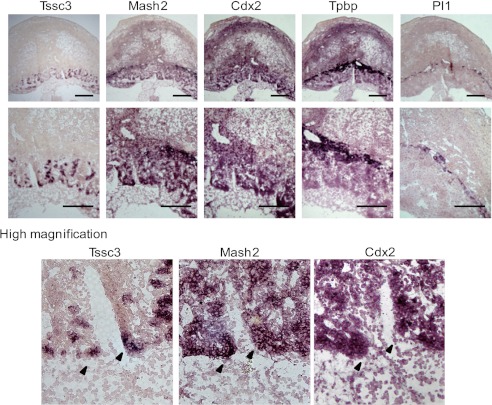
FIGURE 7.
Expression profiles of Tssc3 and Mash2 in the wild-type placenta. The expression patterns of trophoblast-specific markers were analyzed by in situ hybridization on a frozen section of wild-type placenta collected at E10.5. Sense probes are not shown. Top panels, all trophoblast-specific markers were detected in E10.5. Middle panels, Tssc3 and Cdx2 located in labyrinthine layer. Mash2 was expressed in labyrinthine and spongiotrophoblast layers. Tpbp was located in the spongiotrophoblast layer. Pl1 was expressed in giant cells. A, scale bar, 500 μm. Bottom panels, Tssc3 was expressed partially in Mash2-positive or Cdx2-positive areas.

