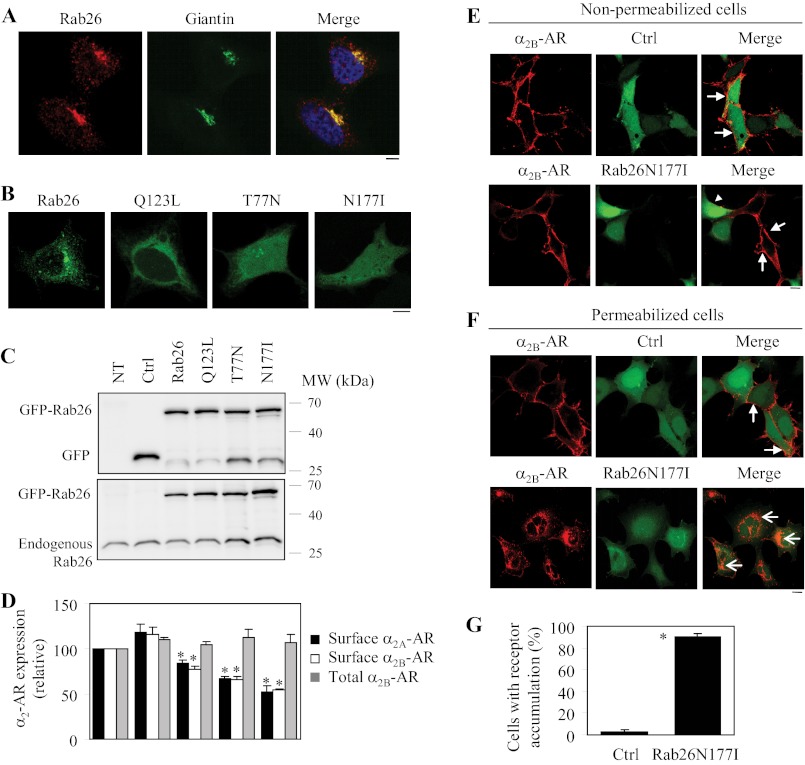
FIGURE 1.
Effect of transient expression of Rab26 and its mutants on the cell surface expression of both α2A-AR and α2B-AR. A, co-localization of endogenous Rab26 with the Golgi marker giantin. HEK293 cells cultured on coverslips were stained with Rab26 (1:100 dilution) and giantin (1:500 dilution) antibodies followed by staining with Alexa 594- and 488-conjugated secondary antibodies (1:300 dilution). Co-localization of Rab26 and giantin was revealed by confocal microscopy. Red, Rab26; green, giantin; yellow, co-localization of Rab26 and giantin. B, subcellular distribution of Rab26 and its mutants Q123L, T77N, and N177I. GFP-tagged Rab26 and its mutants were expressed in HEK293 cells, and their subcellular distribution was detected by confocal microscopy. C, Western blot analysis of the expression of Rab26 and its mutants. HEK293 cells were cultured on 6-well plates and transfected with the pEGFP-C1 vector (Ctrl), Rab26, or individual Rab26 mutant tagged with GFP. Total cell homogenates were separated by 12% SDS-PAGE, and the expression of Rab26 was detected by immunoblotting using GFP (upper panel) and Rab26 antibodies (lower panel). NT, nontransfection. The molecular mass (MW) markers (kDa) are indicated on the right. The apparent molecular masses of GFP-Rab26, GFP and endogenous Rab26 are ∼56, 27, and 27 kDa, respectively. D, effect of Rab26 and its mutants on the cell surface expression of α2A-AR and α2B-AR. HEK293 cells stably expressing α2B-AR were transfected with GFP-Rab26, and α2A-AR and GFP-Rab26 were transiently co-expressed in HEK293 cells. The cell surface expression of α2A-AR and α2B-AR was determined by intact cell ligand binding using [3H]RX821002 at a concentration of 20 μm as described under “Experimental Procedures.” The nonspecific binding was determined in the presence of rauwolscine (10 μm). The mean values of specific [3H]RX821002 binding were 13,240 ± 530 and 25,589 ± 3716 cpm from control cells expressing α2A-AR and α2B-AR, respectively. The total α2B-AR expression was measured by flow cytometry measuring the GFP signal in cells transfected with GFP-tagged α2B-AR together with individual Rab26. The data shown are percentages of the mean values obtained from control cells and are presented as the means ± S.E. of at least three different experiments each in triplicate. *, p < 0.05 versus Ctrl. E and F, effect of Rab26N177I on the subcellular distribution of α2B-AR in nonpermeabilized (E) and permeabilized cells (F). HEK293 cells stably expressing HA-α2B-AR were cultured on coverslips and transfected with the pEGFP-C1 vector (Ctrl) or GFP-tagged Rab26N177I. In F, the cells were treated with 0.2% Triton X-100 for 5 min. The subcellular distribution of α2B-AR was revealed by confocal microscopy following sequential staining with HA antibodies (1:1500 dilution) and Alexa 594-conjugated secondary antibodies as described under “Experimental Procedures.” Red, HA-α2B-AR; green, GFP (upper panels) or GFP-Rab26N177I (lower panels). Closed arrows indicate the cell surface expression of α2B-AR; an arrowhead indicates the reduction of the cell surface α2B-AR in a cell expressing GFP-Rab26N177I; open arrows show extensive accumulation of α2B-AR in permeabilized cells expressing GFP-Rab26N177I. In A, B, E, and F, the data shown are representative images of at least three independent experiments. Scale bars, 10 μm. G, quantitative data of F. The data shown are percentages of the mean values and are presented as the means ± S.E. of three different experiments.

