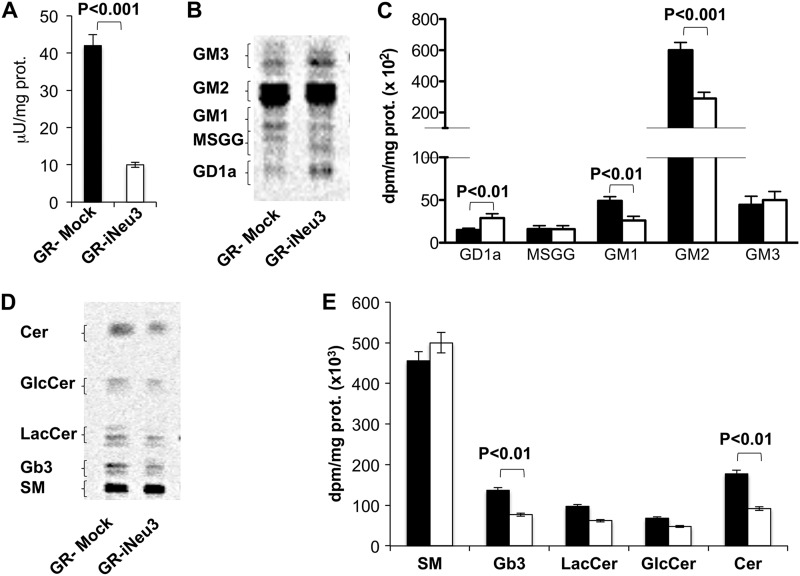
FIGURE 8.
Effect of NEU3 silencing on GR-TC cell sphingolipid pattern. A, sialidase activity of mock and GR-iNeu3 cells assayed with [3H]GD1a at pH 3.8. B, HPTLC separation of GR- mock and GR-iNeu3 cell gangliosides. Doublets are due to the heterogeneity of the ceramide moiety. Solvent system: chloroform/methanol/0.2% aqueous CaCl2 60:40:9 (v/v). Image acquired by radiochromatoscanning (Beta Imager 2000). C, ganglioside content of GR-mock (black bar) and GR-iNeu3 (white bar) cells. Values are the mean ± S.D. of three independent experiments. D, HPTLC separation of GR-mock and GR-iNeu3 cell neutral sphingolipids. Solvent system: chloroform/methanol/H2O 55:20:3 (v/v). Image acquired by radiochromatoscanning (Beta Imager 2000). E, neutral sphingolipid content of GR-mock (black bar) and GR-iNeu3 (white bar) cells. Values are the mean ± S.D. of three independent experiments.

