FIGURE 9.
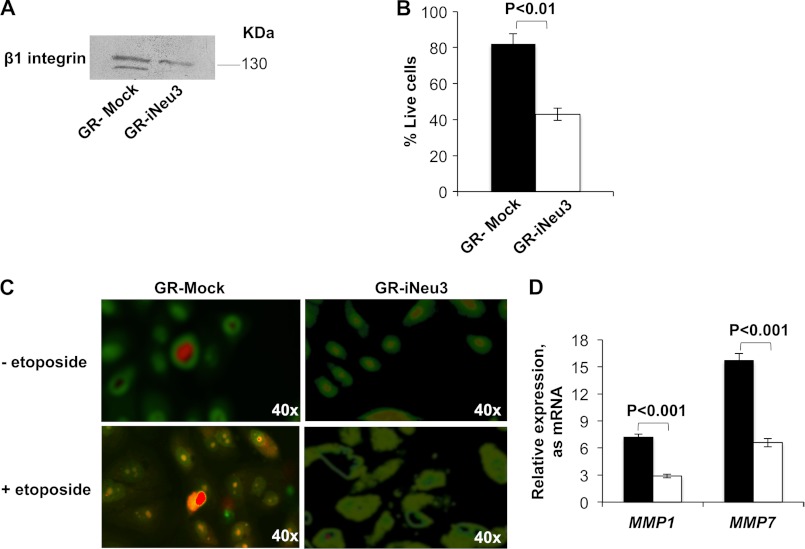
Effect of NEU3 silencing on GR-TC cells. A, Western blot image of GR-mock and GR-iNeu3 cell membrane fractions probed with anti-β1 integrin antibody. An equal amount of proteins was loaded in each lane. Blots are representative of four independent experiments. B, GR-mock (black bar) and GR-iNeu3 (white bar) cell viability assessed through SYTOX staining after etoposide treatment. Values are the mean ± S.D. of three independent experiments. C, detection of acidic vesicular organelles in etoposide-treated GR-mock and GR-iNeu3 cells through acridine orange staining. Cells were examined by fluorescence microscope. Representative images from three independent experiments were shown. Original magnification ×40 (Olympus Ix50). D, real time PCR analysis of MMP1 and MMP7 mRNA expression in GR-mock (black bar) and GR-iNeu3 (white bar) cells. Values are the mean ± S.D. of three independent experiments.

