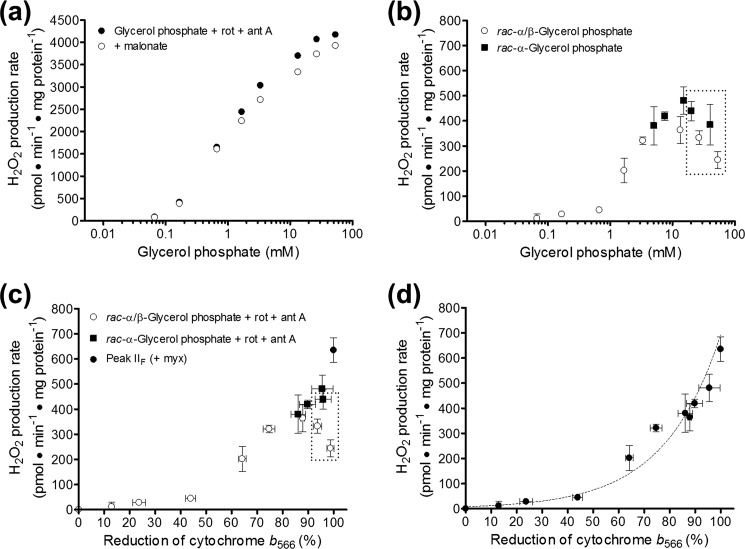
FIGURE 5.
Relationship between H2O2 production by complex II and reduction of cytochrome b566. a, effect of malonate on H2O2 production rates in the absence of site IIIQo inhibitors. H2O2 production rates were measured in skeletal muscle mitochondria oxidizing glycerol 3-phosphate in the presence of 4 μm rotenone and 2.5 μm antimycin A (site IIIQi inhibitor) (black circles) and in parallel with the further addition of 1 mm malonate (white circles). Data are means only for clarity; S.E. values were similar to other panels (n = 3–5). b, using the conditions in a, the malonate-sensitive component of the H2O2 production rates were determined with rac-α/β-glycerol phosphate (25% active substrate sn-glycerol 3-phosphate, white circles, n = 3–5) or rac-α-glycerol phosphate (50% active substrate sn-glycerol 3-phosphate, black squares, n = 2–4). Data are means ± S.E. (error bars). The dashed box encompasses all points for glycerol phosphate ≥20 mm. c, H2O2 production rates from b replotted against cytochrome b566 values under identical conditions from Fig. 1e and Fig. 2c. The peak H2O2 production rate from site IIF in the presence of the site IIIQo inhibitor myxothiazol is replotted from Fig. 3b (black circle). Data are means ± S.E. d, data from c replotted as a unified set omitting the data points for glycerol phosphate ≥20 mm (dashed box in c) and fit to an exponential curve of the equation, Rate of H2O2 production driven by electron flow from the Q-pool into complex II in pmol·min−1·mg of protein−1 = 8.0·e(0.045·%b566 reduction). Data are means ± S.E. Rot, rotenone; myx, myxothiazol; ant A, antimycin A.

